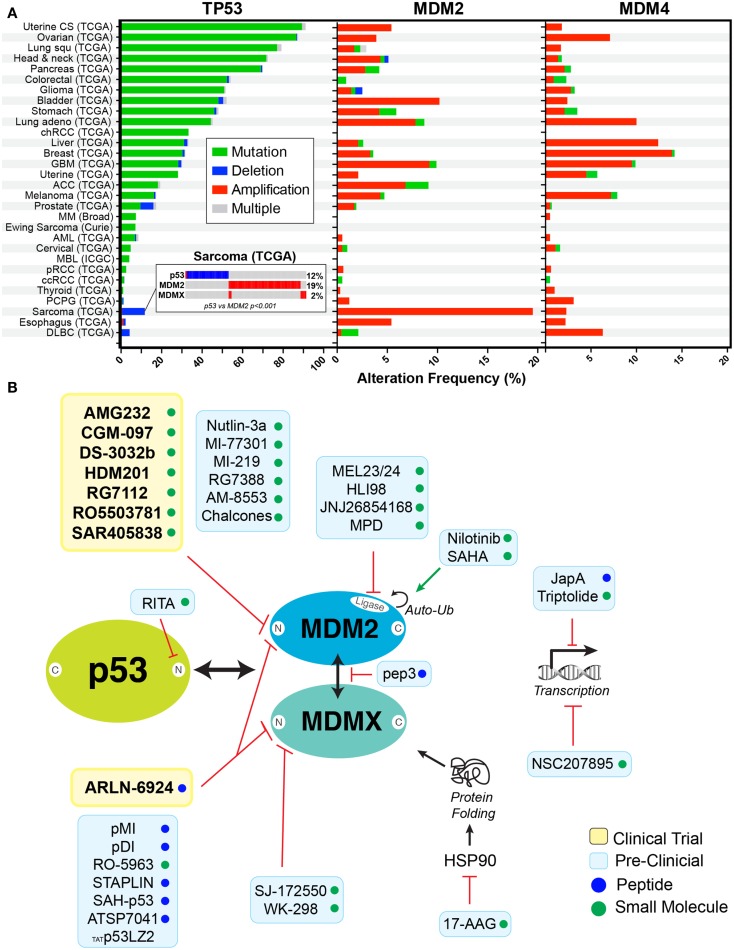
Figure 1.
Rationale for targeting p53 in cancers. (A) Frequency of alterations are shown with mutation (green), deletion (blue), amplification (red), and combination of alterations (gray) in p53, MDM2, and MDMX in cancers derived from cBioPortal (5) (http://www.cbioportal.org). Insert shows the mutual exclusivity observed between MDM2 expression and p53 deletion in sarcomas. (B) Schematic representation of inhibitors in clinical trials (yellow box) or in preclinical studies (blue box) targeting the p53–MDM2/X axis. Compounds are either small molecules (green circle) or peptide (blue circle).

