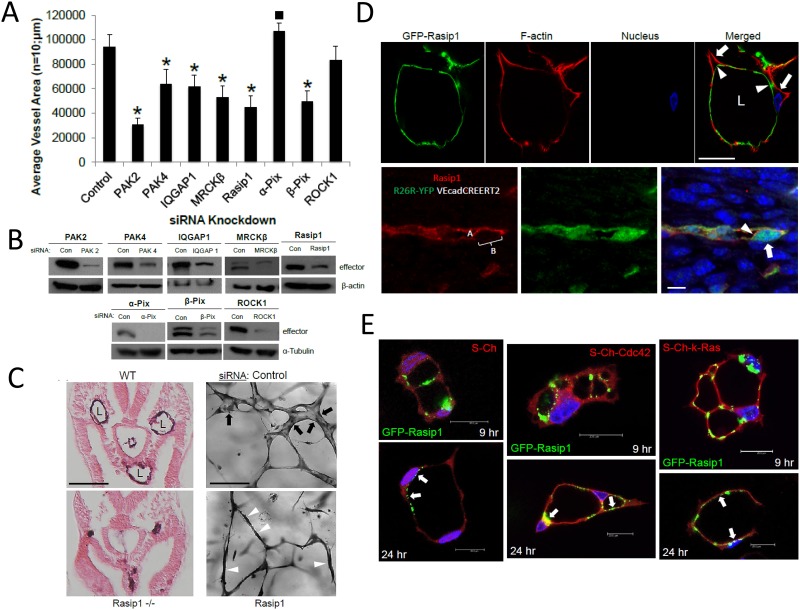
Fig 6. IQGAP1, MRCKβ, Rasip1, and beta-Pix are critical downstream effectors of small GTPase signaling that control EC tubulogenesis: Rasip1 controls EC tubulogenesis in vivo during mouse development and targets to the EC apical surface in vitro and in vivo.
(A) Individual EC cultures were transfected with a control siRNA or siRNAs that are directed to the indicated molecules and were then suspended in 3D collagen matrices for 72 hr using the Factor-induced model. Data are reported as mean vessel area ± SD per HPF (n = 10; p < 0.01). Asterisk indicates significance below control while square indicates significance above control. (B) Lysates generated from siRNA transfected cultures in (A) were used in Western Blot analysis and probed for the indicated molecules compared to tubulin controls to assess siRNA suppression. (C) Left panels- Wild type vs. Rasip1 knockout mice were cross-sectioned at E8 and were stained with CD31 antibodies. Vascular lumens (L) are observed in the wild type but not the knockout mice. Bar equals 500 μm. Right panels- ECs were treated with control vs. Rasip1 siRNAs, were seeded in 3D collagen matrices, and after 72 hr, were fixed, stained and photographed. Black arrows indicate EC tubes with lumens, while white arrowheads indicate EC cords without lumens mimicking the in vivo observations seen in the left panels. Bar equals 50 μm. (D) Rasip1 is shown to target to the EC apical surface during tubulogenesis in vitro vs. in vivo. Upper panel- ECs were infected with adenoviruses carrying GFP-Rasip1 and PKCɛ, were cultured in 3D matrices and after 24 hr, cultures were fixed, and stained with phalloidin. Arrowheads indicate apical labeled of Rasip1, while the arrows indicate basal labeling of F-actin. Bar equals 25 μm. Lower panel- Immunofluorescent staining of Rasip1 in developing mouse vessels demonstrates apical targeting of Rasip1. Arrowheads indicate apical staining of Rasip1 (also labeled A), while the arrow indicates a basal region without staining (also labeled B). Bar equals 5 μm. (E) ECs were induced to express GFP-Rasip1, mCherry (Ch), Ch-Cdc42, and Ch-k-Ras, allowed to undergo lumen formation, then fixed at the indicated times and imaged by confocal microscopy. Arrows indicate apical and sub-apical targeting of Rasip1 during different stages of EC lumen formation. Bars equal 20 μm.

