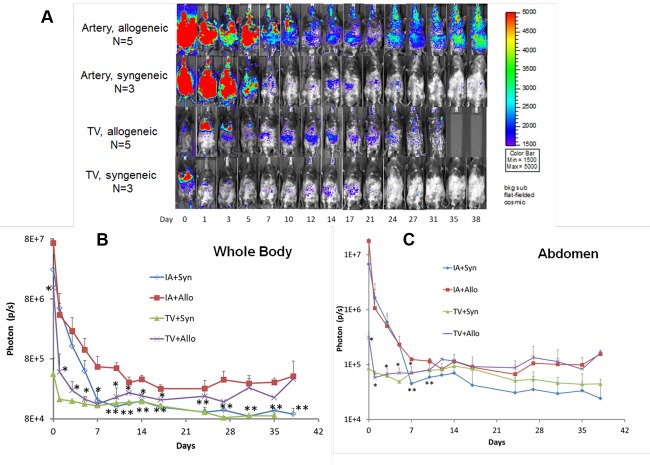
Figure 3.
(A) BLI of syngeneic and allogeneic transplant mice receiving one million hMSCs via IA and TV injection on days 1 and 4 after BMT. Indicated days refer to days after BMT. Results from one of two representative experiments are shown. (B) Quantitative analysis of the photon flux by drawing a region of interest (ROI) in the whole body. p < 0.05 (*) for mean photon flux between the IA allogeneic and the TV allogeneic group before day 17, and p < 0.05 (**) for mean photon flux between the IA allogeneic and IA syngeneic groups after day 7. (C) Quantitative analysis of the photon flux by drawing a region of interest (ROI) in the abdominal area. p < 0.05 (*) for mean photon flux between the IA allogeneic group and the TV allogeneic group before day 7; and p < 0.05 (**) for mean photon flux between IA allogeneic and IA syngeneic groups on days 7 and 10.

