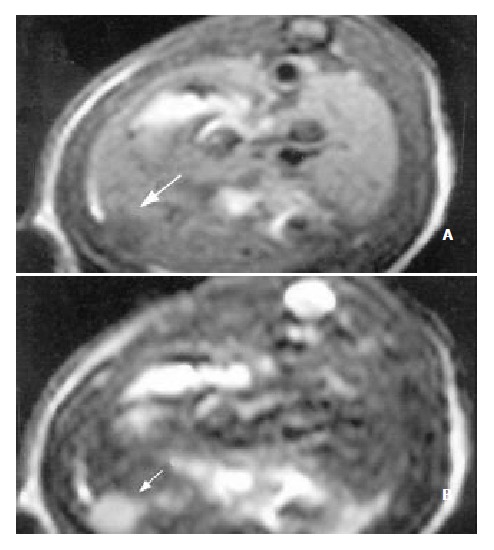
Figure 3.

MR images of HCC after the application of Plcg-Mitomycin-microspheres: (a) MRI T1WI (400/14 ms); (b) MRI T2WI (3000/96 ms). The tumor volume after the application of Plcg-Mitomycin-microspheres was not changed compared to that before the application.
