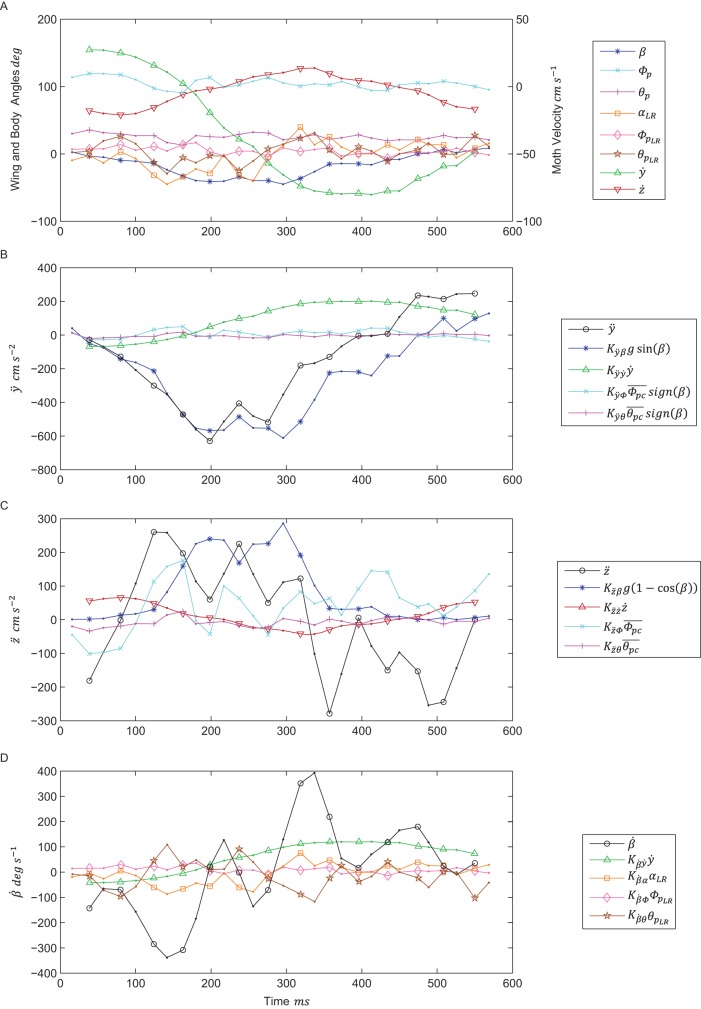
Fig. 2.
Example trial segment. (A) ≈580 ms (14.5 wingbeat) segment of midstroke body and wing kinematic data from a representative trial segment. This segment begins with a lateral deceleration followed by an acceleration in the opposite direction. (B-D) Estimated contribution of moth wing and body kinematics to ÿ, z̈, and  , respectively. ÿ,
  , and z̈ are in bold black, plotted against the independent variables from Eqns 1-3 after they are first multiplied by the estimated coefficients from the best linear mixed model of each orientation derivative. These coefficients are the same as those in Tables 1-2, and estimated from the entire data set. The plots show data at only midstrokes. Upstrokes are denoted by plain dots, while downstrokes are denoted by a different character for each measured variable.

