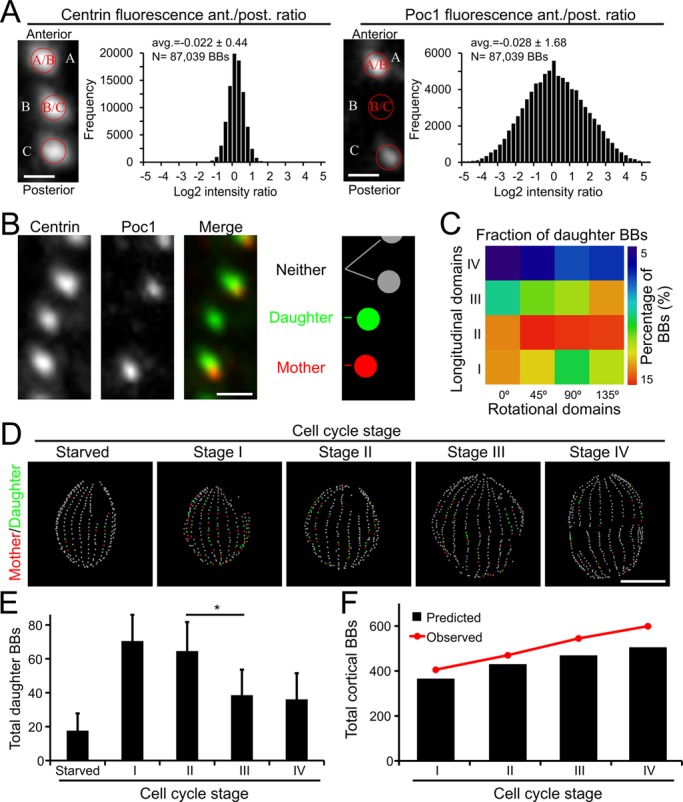
Fig. 4.

The timing and spatial domains of new BB assembly. (A) The image analysis routine measures the fluorescence intensity of fluorescently labeled BB components relative to the anteriorly positioned BB. Centrin (left) incorporation is rapid, which leads to a relatively uniform intensity ratio across all BB pairs. Poc1:GFP (right) incorporates in an age dependent profile, leading to greater distribution of intensity ratios and a broad intensity ratio distribution. Scale bar: 1 µm. N represents the total number of basal bodies from 199 cells imaged from 3 separate cultures. (B) To identify nascent daughter BBs, the analysis routine identifies BB pairs where Poc1 intensity in the anterior BB is 2 fold less than the posterior BB and assigns the posterior BB ‘mother’ status (red) and the anterior BB ‘daughter’ status (green). BBs that do not exhibit greater than a 2-fold Poc1 intensity differential are not assigned mother/daughter status (grey). Scale bar: 1 µm. (C) A spatial analysis of daughter BB position in cycling cells reveals the greatest enrichment in the medial and posterior quadrants. (D) Maps of individual cells highlight mother/daughter BBs (mothers, red; daughters, green; neither, grey). Starved cells cease BB duplication and contain very few mother/daughter BBs. Scale bar: 15 µm. (E) Quantification of the total number of new BBs at each cell cycle stage. *P<0.05, data is represented as mean±s.d. Significance between groups was determined using an unpaired two-tailed t-test. (F) The predicted number of cortical BBs (black bars) based on the observed number of new daughter BBs at each cell cycle stage compared to the observed number of total cortical BBs (red circles and lines; adapted from Fig. 3C). N=32 Starved; N=127 Stage I, N=42 Stage II, N=19 Stage III, N=11 Stage IV; these values represent the cumulative number of cells imaged from three separate cultures.
