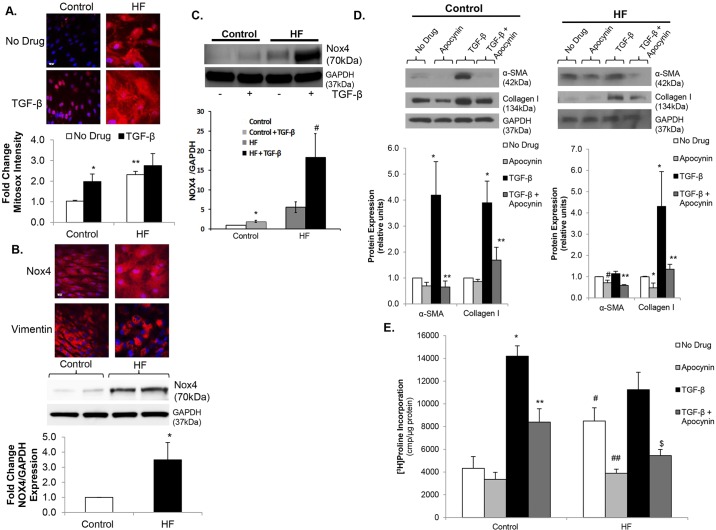
Fig. 1.
Mitochondrial superoxide production and Nox4 are upregulated in failing cardiac fibroblasts. (A) Confocal images (upper panel) of control and heart failure (HF) cardiac fibroblasts (CFs) stained with MitoSOX (red) under basal conditions (No Drug) vs TGF-β stimulation. Nuclei are stained blue with Hoechst 33342. Fluorescence quantitation shown below demonstrates an over twofold increase in mitochondrial oxidative stress in control CFs in response to TGF-β. *P<0.03 vs Control+No Drug; **P<0.005 vs Control+No Drug; n=3-4 in all groups. Scale bar: 20 μm. (B) Confocal images (upper panel) of Nox4 stained red with Alexa-Fluor-594 dye are show in in HF versus control CFs. Nuclei are stained blue with DAPI. Representative immunoblot (middle panel) showing Nox4 expression in HF versus control CFs. GAPDH was used as a loading control. Densitometric analysis (lower panel) demonstrates an over fourfold increase in Nox4 expression in HF. *P<0.05 vs Control; n=4 in all groups. This membrane was stripped, re-probed and quantitated in Fig. 3A. Scale bar: 20 μm. (C) Representative immunoblot (upper panel) showing Nox4 expression under basal conditions and following TGF-β stimulation in control and HF CFs. GAPDH was used as a loading control. Densitometric analysis (lower panel) demonstrates increased Nox4 expression in response to TGF-β in both control and HF. *P<0.05 vs No Drug; #P<0.05 vs No Drug; n=5 in all groups. (D) Representative immunoblots (upper panels) showing the effects of apocynin on basal and TGF-β-stimulated α-SMA and collagen I expression in both control (left) and HF (right) CFs. GAPDH was used as a loading control. Densitometric analysis shown below. *P<0.02 vs No Drug, **P<0.03 vs TGF-β, #P<0.05 vs No Drug; n=3-4 for all groups. (E) Collagen synthesis in HF versus control CFs under basal conditions, TGF-β stimulation, apocynin treatment, and pre-treatment with apocynin prior to stimulation with TGF-β. *P<0.001 vs Control+No Drug; **P<0.002 vs Control+TGF-β; #P<0.003 vs Control+No Drug; ##P<0.01 vs HF+No Drug; $P<0.002 vs HF+TGF-β; n=3 in all groups.

