Fig. 5.
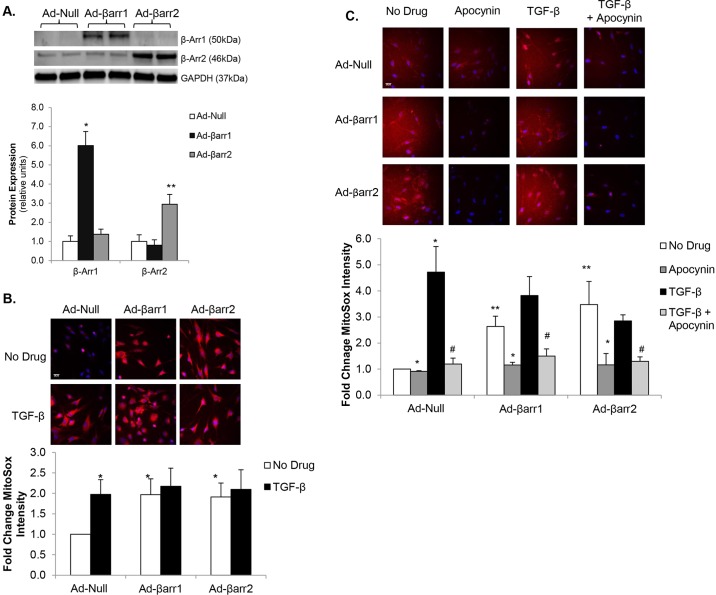
β-arrestin overexpression increases mitochondrial oxidative stress. (A) Representative immunoblot (upper panel) showing β-arrestin-1 (β-Arr1) and β-arrestin2 (β-Arr2) expression following transfection with adenoviruses overexpressing β-arrestin-1 (Ad-βarr1), β-arrestin-2 (Ad-βarr2), or control null virus (Ad-Null). GAPDH was used as a loading control. Densitometric analysis of β-arrestin-1 and β-arrestin-2 normalized to GAPDH expression is shown below. *P<0.001 vs Ad-Null and vs Ad-βarr2, **P<0.03 vs Ad-Null and vs Ad-βarr1; n=3-4 in all groups. (B) Confocal images (upper panel) of control cardiac fibroblasts (CFs) stained with MitoSOX (red) following transfection with Ad-βarr1, Ad-βarr2 or Ad-Null. Nuclei are stained blue with Hoechst 33342. Fluorescence quantitation is shown below. *P<0.05 vs Ad-Null+No Drug; n=3-5 in all groups. (C) Confocal images of transfected CFs stained with MitoSOX (red) showing mitochondrial oxidative stress under basal conditions, TGF-β stimulation, apocynin treatment, and pre-treatment with apocynin prior to stimulation with TGF-β (TGF-β+Apocynin). Nuclei are stained blue with Hoechst 33342. Fluorescence quantitation is shown below. *P<0.02 vs No Drug; **P<0.03 vs Ad-Null+No Drug; #P<0.02 vs TGF-β; n=3 in each group. Scale bars: 20 μm.

