Fig. 7.
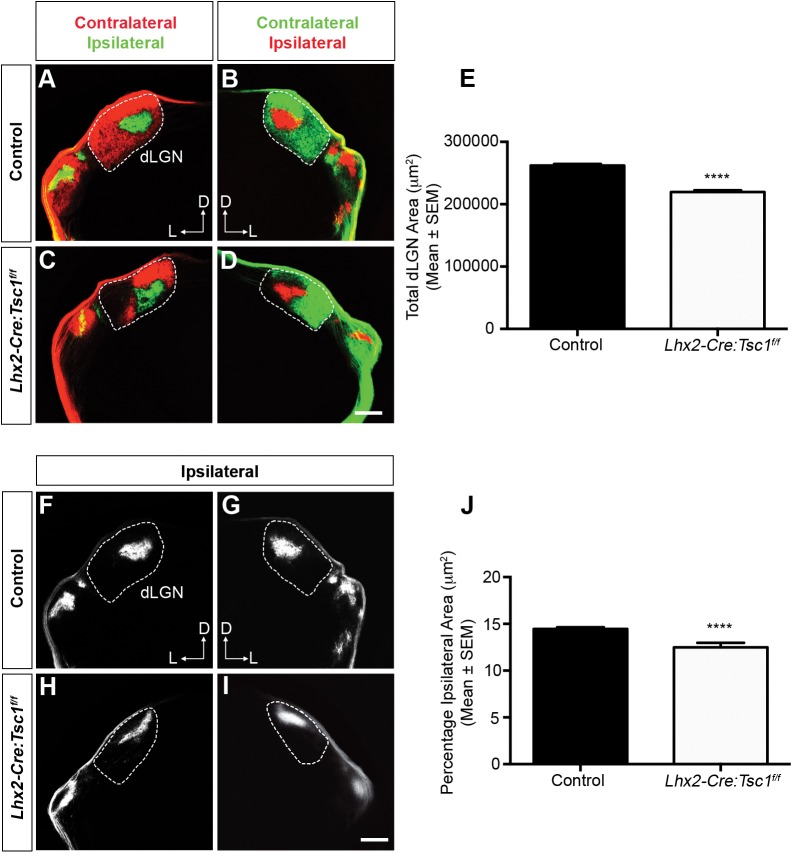
Conditional deletion of Tsc1 leads to aberrant retinogeniculate topography. (A-D) Medial coronal sections showing retinogeniculate projections into the dLGN at P14 in control (A,B) and Lhx2-Cre:Tsc1f/f (C,D) mice. Dashed lines represent the borders of the dLGN. A reduction in the area occupied by both contralateral and ipsilateral projections is evident in Lhx2-Cre:Tsc1f/f mice. (E) Quantification of the total dLGN area (µm2) in control and Lhx2-Cre:Tsc1f/f mice at P14. The data represent the mean±s.e.m. of three mice from each genotype. A significant reduction in the total area occupied by both contralateral and ipsilateral projections is evident in Lhx2-Cre:Tsc1f/f mice. (F-I) Medial coronal sections showing the ipsilateral retinogeniculate projections into the dLGN at P14 in control (F,G) and Lhx2-Cre:Tsc1f/f (H,I) mice. Dashed lines represent the borders of the dLGN. The topographical appearance and position of the ipsilateral patch within the dLGN of Lhx2-Cre:Tsc1f/f mice was altered along the dorsoventral and lateromedial axis. (J) Quantification of the percentage ipsilateral projection area in control and Lhx2-Cre:Tsc1f/f mice at P14. The data represent the mean±s.e.m. of three mice from each genotype. A significant reduction in the percentage area occupied by the ipsilateral projection is evident in Lhx2-Cre:Tsc1f/f mice. Scale bars: (A-D,F-I) 250 µm. Abbreviations: D, dorsal; dLGN, dorsal lateral geniculate nucleus; L, lateral. P-values are denoted as follows: ****P≤0.0001 compared with controls.

