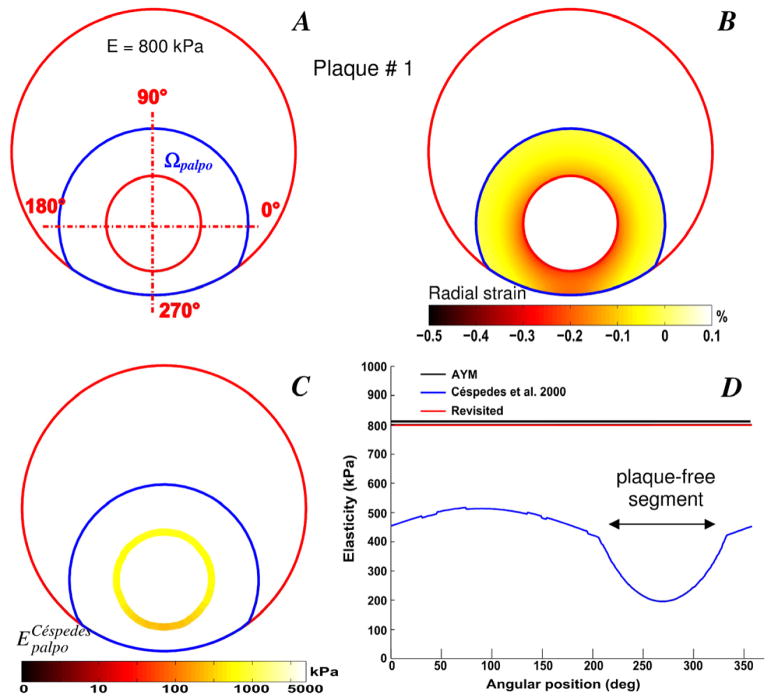
Figure 1.
Performance of the improved elasticity-palpography technique. A) Contours (in red) of an idealized eccentric and circular plaque model (called plaque # 1) in which the lesion is homogeneous. The palpography domain Ωpalpo is also given (blue contours). B) Radial strain-elastogram computed in the palpography domain. C) Computed native Céspedes et al. (2000) stress-strain modulus (S-SM) palpogram. D) Comparisons between native S-SM of Céspedes et al. (2000), improved S-SM and averaged Young’s modulus (AYM) palpograms.

