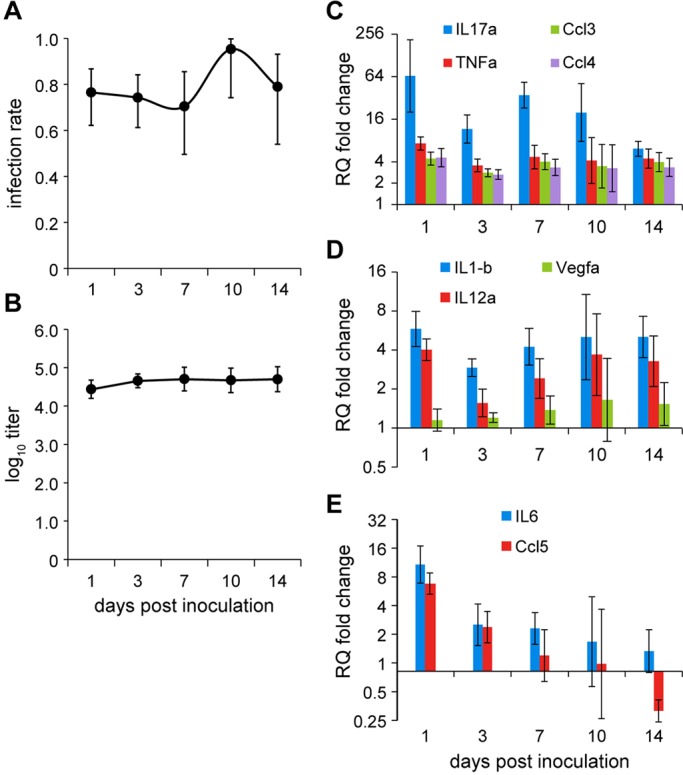
Fig. 6.

Host innate immune response in NTHi-infected bulla fluids. (A,B) ME infection rate (A) and titre (B) in 8-week-old Jbo/+ mice inoculated with 106 CFU of NTHi 375 (n=12 per cohort); mean±95% CI. (C-E) Modulation of gene expression in NTHi-infected ME samples relative to GF ME samples detected by RT-qPCR. Each time point represents biological replicate pools of n=3-6 NTHi-infected ears and n=10 biological replicate pools of GF bulla samples as baseline controls; data are represented as mean relative quantification (RQ)±95% CI.
