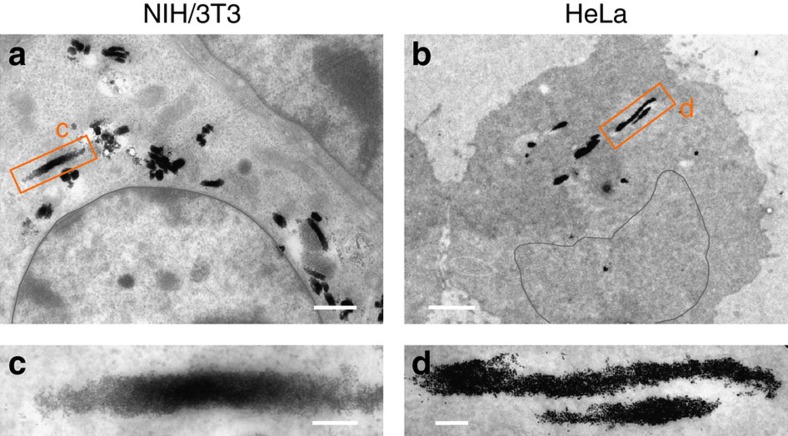
Figure 2. Localization of wires inside living cells.
Representative transmission electron microscopy image of (a) NIH/3T3 fibroblasts and (b) HeLa cancer cells incubated with 2.4 μm wires for 24 h at the concentration of 10 wires per cell. For the fibroblasts, clusters in the range of 200 nm are also visible. Scale bars in a,b are 1 and 2 μm, respectively. (c,d) Close-up views of regions marked by an orange rectangle in a,b respectively, indicating that the wires are not enclosed in membrane-bound compartments. Scale bars are 200 nm.

