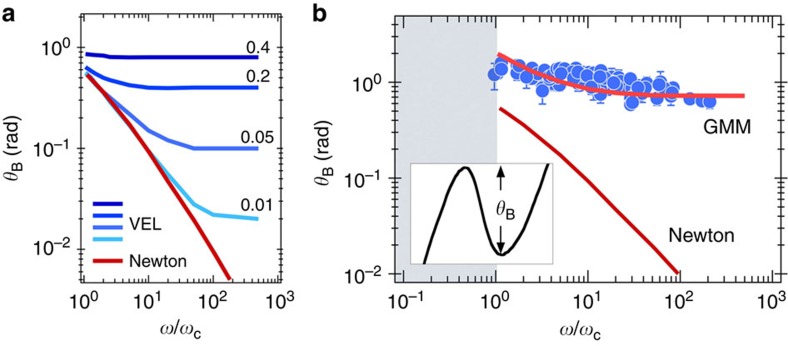
Figure 5. Master curve for wire oscillation amplitude in cells.
(a) Average rotation velocity Ω(ω) of a magnetic wire calculated for a Newtonian fluid and for a viscoelastic liquid (indicated as VEL) of relaxation times ranging from 0.01/ωC (light blue) to 0.4/ωC (dark blue). (b) Variation of θB as a function of the reduced frequency ω/ωC for wires of lengths 1.9 to 5.9 μm. The continuous lines were obtained from the Newtonian and from the Generalized Maxwell (GMM) models. Inset: definition of θB. Error bars in b are defined as s.e.m.

