
Figure 6. Scaling critical frequency and wire length.

Variation of the critical frequency ωC as a function of the reduced wire length 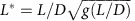 for (a) NIH/3T3 mouse fibroblasts and (b) for HeLa cervical cancer cells. Straight lines in red are least-square fits using power laws with exponent (exp.) −3 and −6.5, respectively, whereas straight lines in green are obtained from equation (2). Error bars are defined as s.e.m.