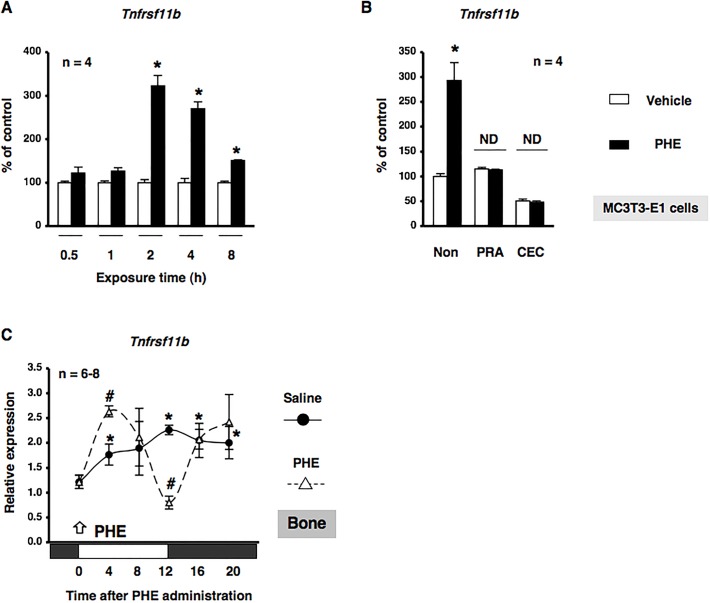
Fig. 6.
α1B-AR signaling regulated Tnfrsf11b gene expression in osteoblasts. (A) Cells were treated with 10 µM PHE for 0.5, 1, 2, 4, and 8 h, harvested, and then processed for real time qRT-PCR. Each value represents the mean±s.e.m. of four separate experiments. *P<0.05, significantly different from each control value obtained in MC3T3-E1 cells cultured in the absence of PHE. (B) Effects of the pretreatments with prazosin (PRA): a selective α1-AR antagonist, or chloroethylclonidine (CEC): an α1B-adrenoceptor-selective antagonist, on PHE-mediated Tnfrsf11b expression in MC3T3-El osteoblastic cells. Each inhibitor was administered 15 min before, cells were then treated with 10 µM PHE for 2 h, harvested, and processed for real time qRT-PCR. These transcription levels were achieved using specific primers for Tnfrsf11b. Relative mRNA expression was normalized to Gapdh. Each value represents the mean±s.e.m. of four separate experiments. *P<0.05, significantly different from the control value obtained in the absence of PHE. NS, not significant. (C) The effects of the intraperitoneal administration of PHE at 10 µg/g on the rhythmic expression of Tnfrsf11b mRNA in femurs (cancellous and cortical bone) are shown. C57BL/6J mice were maintained under a 12:12-h light/dark cycle for 2 weeks and PHE was then administrated intraperitoneally at ZT0. Total RNA was isolated from the distal region of the femurs of saline-treated and PHE-treated C57BL/6J mice. mRNA levels of Tnfrsf11b were determined by real time qRT-PCR using specific primers. Each value is the mean±s.e.m. (n=6 or 8 in each group). *P<0.05, significantly higher than the lowest value in a phase. #P<0.05, significantly different from each control value. The arrow indicates PHE administration. White boxes, light period; black boxes, dark period.

