Fig. 2.
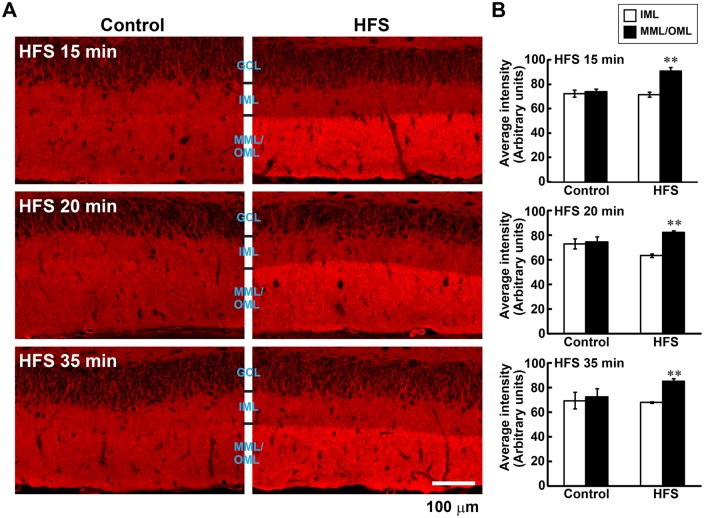
Expression of F-actin after L-LTP-inducing high frequency stimulation (HFS) in the dentate gyrus. (A) Micrographs showing phalloidin-rhodamine staining of F-actin in the dentate gyrus. Left panels, control hemisphere; right panels, HFS hemisphere. Scale bar: 100 µm. (B) F-actin staining is selectively increased in laminae that received HFS (middle/outer molecular layers, MML/OML). Graphs show the average intensity of F-actin in the lower blade of the dentate gyrus. Data from each time point were obtained from three animals. Error bars indicate mean±s.e.m. **P<0.01 versus inner molecular layer (IML) using Student's t-test.

