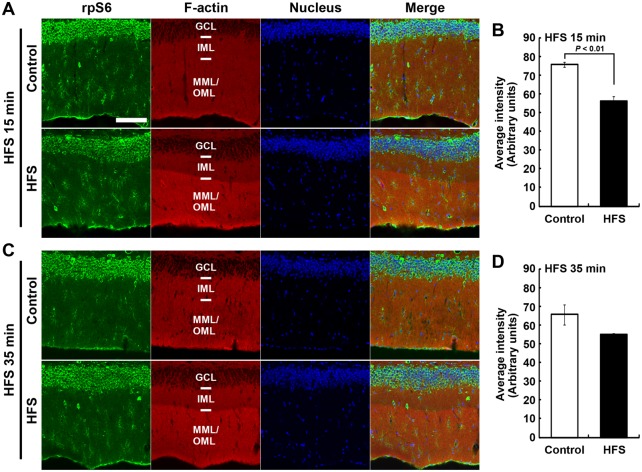
Fig. 3.
Ribosomal protein S6 (rpS6) immunofluorescence and F-actin staining distribution after high frequency stimulation (HFS). (A,C) Micrographs of rpS6 immunostaining, F-actin staining with phalloidin-rhodamine, and DAPI nuclear staining in the dentate gyrus, obtained from 15 min (A) and 35 min (C) under HFS conditions. Scale bar: 100 µm. (B,D) Graphs show average signal intensity of rpS6 in the granule cell layer (GCL). Data obtained from 15 min (B) and 35 min (D) under HFS conditions. Error bars indicate mean±s.e.m. The P value from Student's t-test is shown in panel B.

