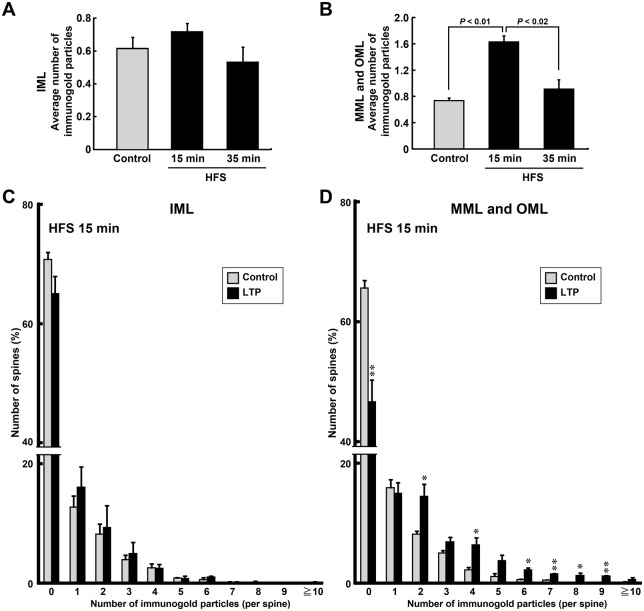
Fig. 5.
Ribosomal protein S6 (rpS6) is selectively and transiently distributed to spines after HFS. (A,B) Graphs of the average number of nanogold particles within each spine of each animal are shown. Data obtained from the inner molecular layer (IML) (A) and middle/outer molecular layers (MML/OML) (B). Error bars indicate mean±s.e.m. P values from Scheffé's post hoc test are shown in panel B. (C,D) Histograms indicate percentage of spines that contain each number of nanogold particles. Average data for each condition were obtained from each animal. (A-D) The number of nanogold particles present in each spine was quantified. Control: IML, n=292, 374, and 130 spines from n=8, 9, and 4 images, respectively; MML and OML, n=912, 765, and 597 spines from n=25, 24, and 13 images, respectively. HFS 15 min: IML, n=273, 79, and 128 spines from n=9, 3, and 5 images, respectively; MML and OML, n=843, 295, and 170 spines from n=24, 9, and 6 images, respectively. HFS 35 min: IML, n=152, 82, and 48 spines from n=4, 3, and 4 images, respectively; MML and OML, n=484, 252, and 69 spines from n=13, 10, and 8 images, respectively. n=3 animals for each condition. Error bars indicate mean±s.e.m. *P<0.05, **P<0.01 versus control using Student's t-tests.

