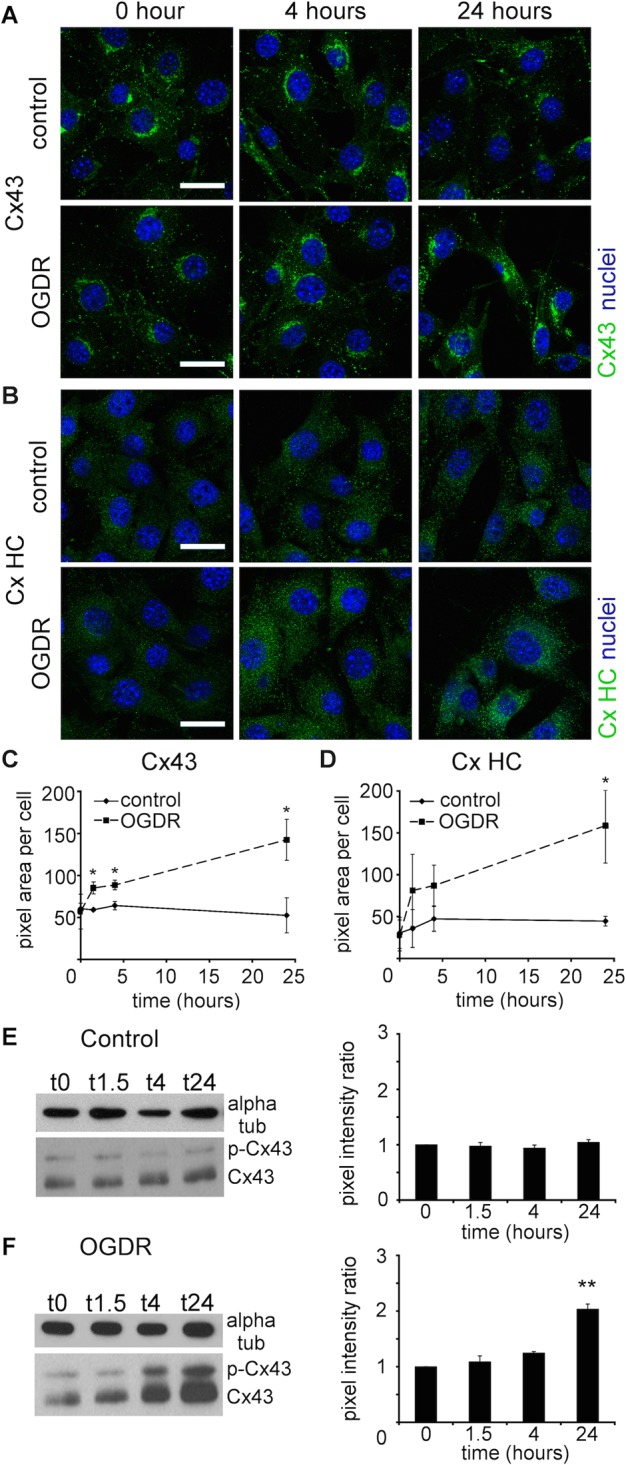
Fig. 4.

OGDR insult significantly increased Cx43 and CxHC protein levels in 3T3 fibroblasts. (A,B) Representative images of (A) Cx43 (green) and (B) CxHC (green) proteins in control 3T3 fibroblasts and that have undergone OGDR stress. (C,D) Labelling intensity of (C) Cx43 and (D) CxHC were quantified. Data are means±s.e.m. (n=4). *P<0.05, t-test. (E,F) Western blots and quantification of (E) Cx43 in control cells and (F) cells subjected to OGDR insult (OGDR WT 3T3) and reperfused for various time period. Alpha tubulin was stained as loading control and used for normalisation. Pixel intensity of the bands was measured. Data are means±s.e.m. n=3, **P<0.01 compared with 0 h, one-way ANOVA. Scale bar=20 µm.
