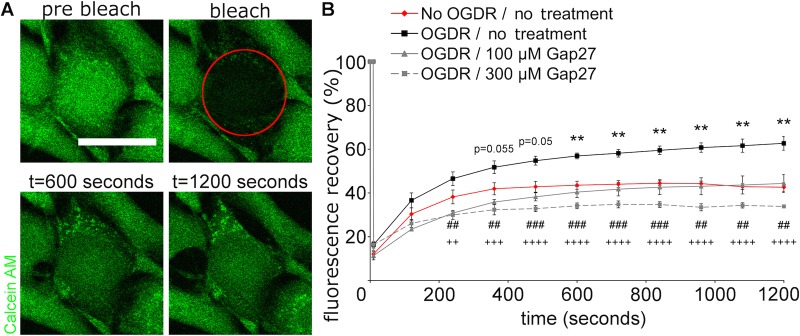
Fig. 5.
High concentration of Gap27 prevented the perturbed GJIC at 4 h after OGDR insult. (A) Representative images of the FRAP experiment. The bleached cell was circled in red. (B) The recovery profiles of fluorescence after FRAP. Data are means±s.e.m. (n=4). **P<0.01 compared with No OGDR, ##P<0.01, ###P<0.001, ++P<0.01, +++P<0.001, ++++P<0.0001 compare with OGDR, one-way ANOVA. Scale bar=25 µm.

