Fig. 6.
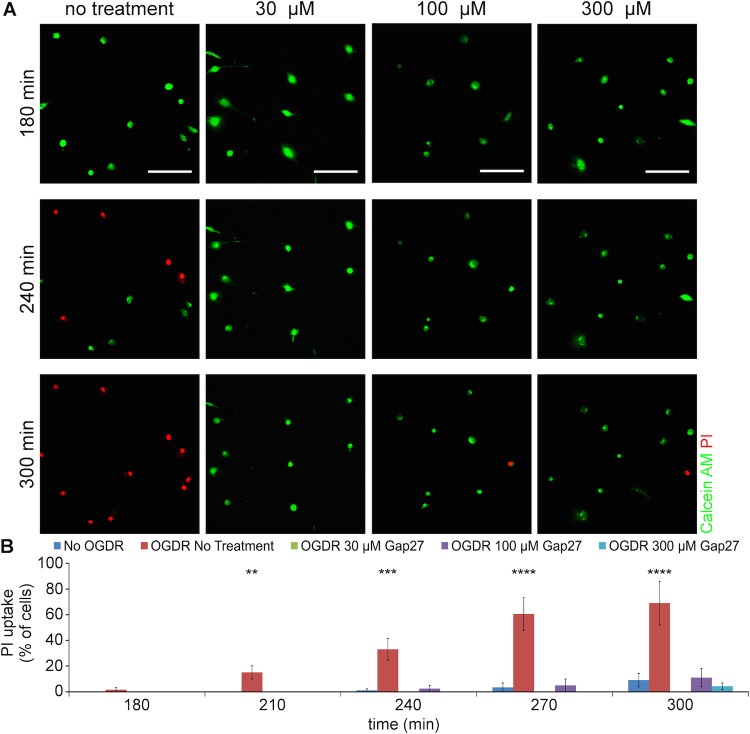
PI uptake in low confluence cells subjected to OGDR insult and Gap27 incubation. (A) Representative images of 3T3 fibroblasts after OGDR insult and Gap27 treatment, up to 5 h after OGDR. Live cells were identified by Calcein AM (green) and cells with open CxHC showed permeation of PI (red). (B) Quantification of PI-positive cells, as a percentage of Calcein-AM positive cells in the first frame of time-lapse. Data are means±s.e.m. (n=4). **P<0.01, ***P<0.001, ****P<0.0001 compare with No OGDR, one-way ANOVA. Scale bar=100 µm.

