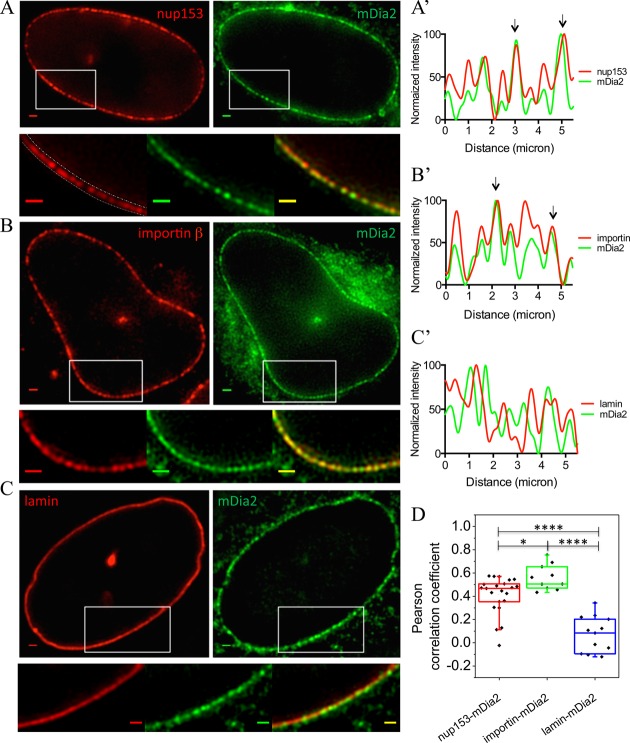
Fig. 3.
Co-localization of mDia2 with the nuclear pore complexes and importin β at the nuclear rim. (A-C) Upper row: reconstructed SIM images of EGFP-mDia2 (green) and (A) nup153, (B) importin β and (C) lamin B1 (red). Lower row: high-magnification images of the individual channels and superimposed image from the regions indicated by the white rectangles. Scale bars: 1 μm. The dashed lines on the high-magnification red channel image of A indicate the border of the nuclear rim. Quantification of fluorescence intensity along the nuclear rim was done by drawing a line with a width of ∼20 pixels on the rim, and the average intensity along the width was taken for each point on the line. (A′-C′) Normalized fluorescence intensity along the nuclear rim in cells labeled with mDia2 (green curve) together with nup153, importin β or lamin B1 (red curve). Co-localizations are indicated by arrows. (D) Pearson correlation coefficient between the fluorescence intensity of the two corresponding channels shown in A-C along the nuclear rim. ****P<0.0001; *P<0.05; two-tailed unpaired Student's t-test.

