
Fig. 2.
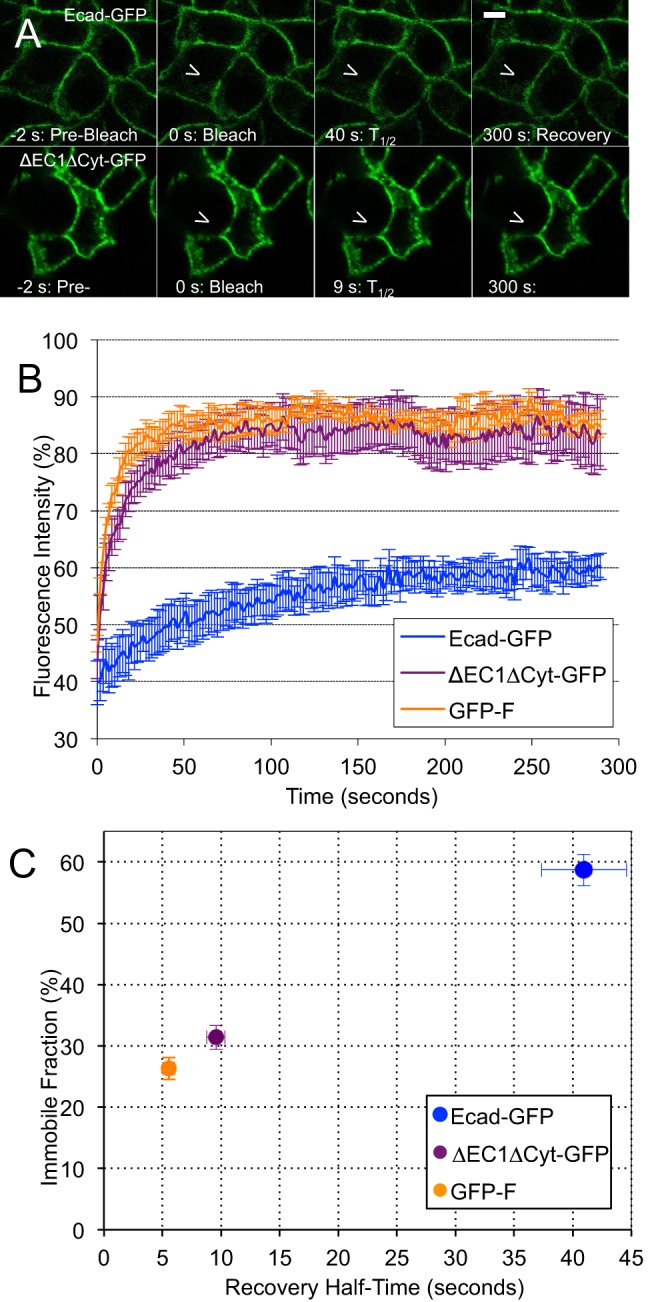
Ecad-GFP is immobilized through adhesive and non-adhesive interactions at cell junctions. (A) FRAP analysis of PDAC cells expressing either Ecad-GFP (top row) or a mutant unable to form cis-, trans-, or actin interactions (ΔEC1ΔCyt-GFP, bottom row). Bar: 5 µm. (B) Average fluorescence recovery curves for Ecad-GFP, ΔEC1ΔCyt-GFP and GFP-F. (C) The half-time of recovery (T1/2) and immobile fraction (Fi) were derived from exponential functions fitted to individual FRAP curves, error bars represent s.e.m. Note that although the graph shows Fi and T1/2, T1/2 is actually a property of Fm. See supplementary material Table S2 for a complete list of FRAP parameters.