Fig. 5.

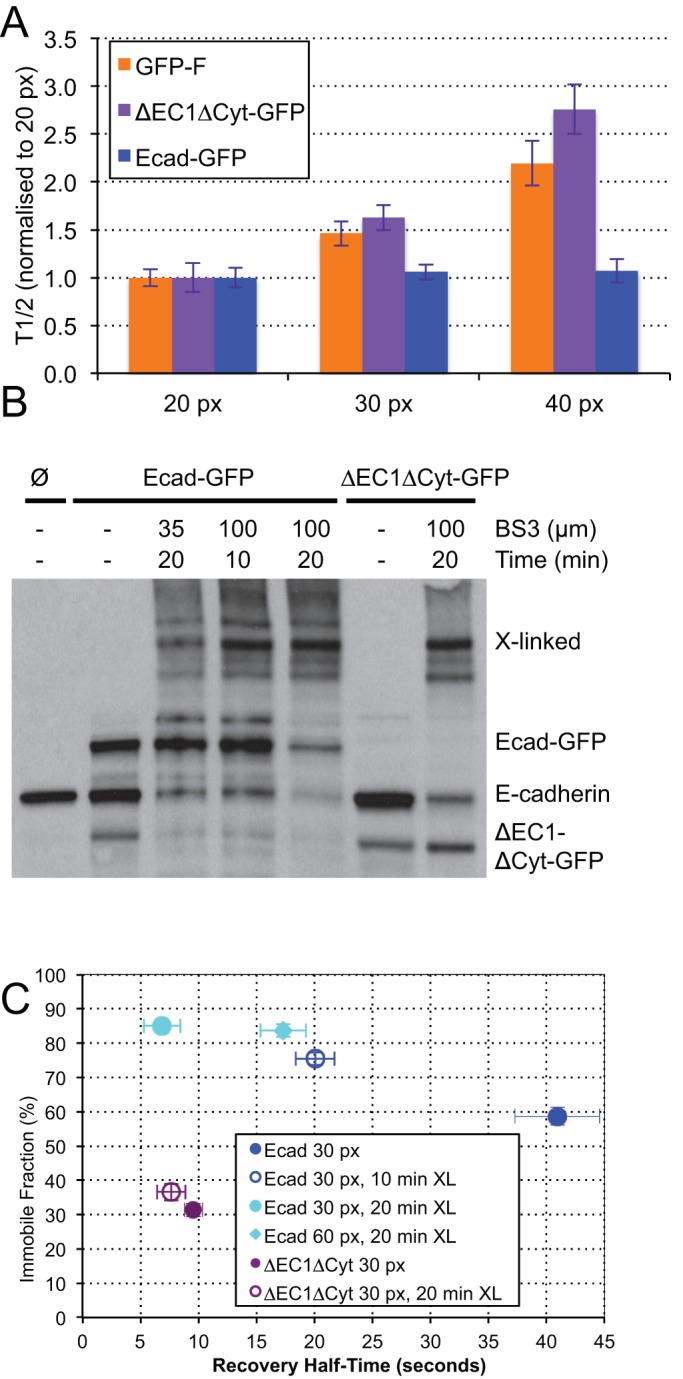
Crosslinking reveals fast and slow recovering populations. (A) FRAP analysis of the effect of ROI size on T1/2. (B) Western blot probed with anti-E-cadherin antibody demonstrating effects of BS3 treatment. PDAC cells express endogenous E-cadherin, whereas Ecad-GFP cells express endogenous and GFP-labeled protein. Treatment for 20 min in 35 µM BS3 or 10 min in 100 µM BS3 inefficiently cross-linked E-cadherin, whereas 20 min in 100 µM BS3 cross-linked the majority of endogenous and GFP-labeled E-cadherin on the cell surface, as evidenced by the reduction in monomeric E-cadherin. Treatment for 20 min in 100 µM BS3 was unable to cross-link ΔEC1ΔCyt-GFP. The band in lane 2 which runs in the position of ΔEC1ΔCyt-GFP is most likely a degradation product of E-cadherin because it does not blot for GFP. (C) FRAP analysis showing the effects of cross-linking and ROI size. Cross-linking of ΔEC1ΔCyt-GFP had no effect on its mobility. In contrast, the Fi of Ecad-GFP cross-linked with BS3 for 20 min increased from 60% to 85% and the T1/2 decreased from 40 s to 7 s. To confirm that the recovery of Ecad-GFP had become diffusion coupled following cross-linking, the ROI diameter was doubled from 30 to 60 pixels, which significantly increased the recovery half-time. Cross-linking PDAC cells for 10 min in 100 µm BS3 only partially shifted the FRAP parameters towards diffusion uncoupled recovery. Values for Ecad-GFP and ΔEC1ΔCyt are included from Fig. 2C for comparison; see supplementary material Table S2 for list of all FRAP values. A,C: error bars represent s.e.m.
