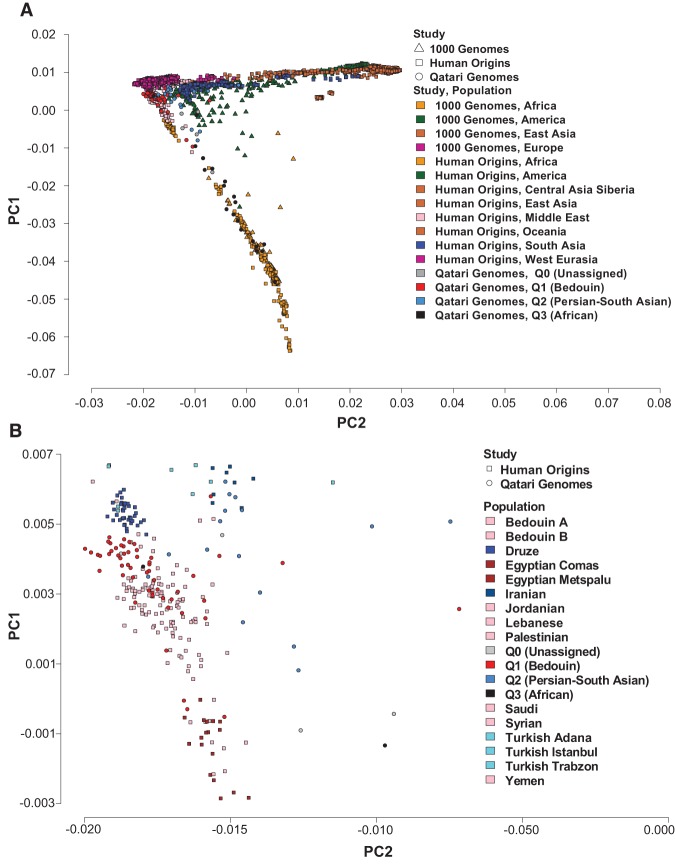
Figure 1.
Principal component analysis (PCA) (Price et al. 2006) of the 104 Qatari genomes (circle), 1000 Genomes (triangle), and Human Origins (square) study samples. Shown are individuals plotted on principal components PC1 and PC2, with genomes color-coded by study and population, with the Q0 (Subpopulation Unassigned) in gray, Q1 (Bedouin) in red, Q2 (Persian-South Asian) in azure, and Q3 (African) in black. (A) Plot of all populations, defined by study and by population, in which all populations from the same region and study are grouped and color-coded together (1000 Genomes: Africa, America, East Asia, and Europe; Human Origins: Africa, America, Central Asia/Siberia, East Asia, Middle East, Oceania, South Asia, and West Eurasia). (B) Plot of Middle Eastern subpopulations from Human Origins that cluster near Q1 (Bedouin) and Q2 (Persian-South Asian).

