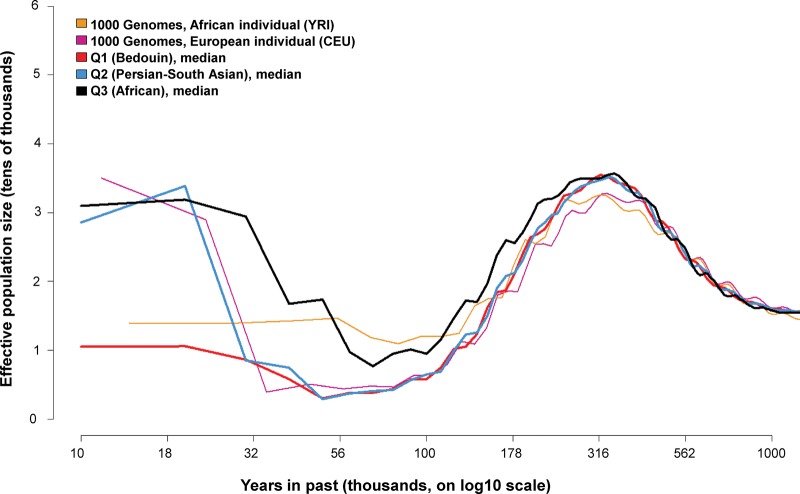
Figure 3.
Ancient bottlenecks in the 96 Q1 (Bedouin), Q2 (Persian-South Asian), or Q3 (African) Qatari genomes (56 Q1, 20 Q2, 20 Q3) determined by pairwise sequential Markov coalescent analysis (Li and Durbin 2011). Shown is the plot of the median effective population size (y-axis) across individuals in a subpopulation versus years in the past (log scale x-axis) for the samples in the three major Qatari subpopulations: Q1 (Bedouin) in red, Q2 (Persian-South Asian) in azure, Q3 (African) in black. A single individual of European ancestry (NA12879, violet) and a single individual of African ancestry (NA19239, orange) from the 1000 Genomes Project deep-coverage pilot (The 1000 Genomes Project Consortium 2010) are shown for comparison.

