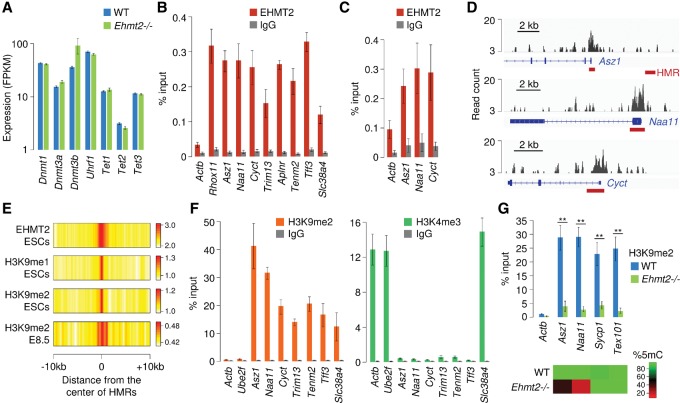
Figure 5.
HMRs are bound by EHMT2 and marked by H3K9me2. (A) RNA-seq quantification of the expression of genes encoding components of the DNA methylation machinery in Ehmt2−/− and WT E9.5 embryos (mean FPKM ± SEM, n = 2 embryos). (B) ChIP-qPCR analysis of EHMT2 binding at HMRs in primary mouse embryonic fibroblasts (MEFs), represented as the percentage of input (mean ± SEM, n = 5). ChIP assays were performed with an antibody against EHMT2 and a control rabbit IgG. Actb served as a negative control, and Rhox11 was chosen as a positive control (Myant et al. 2011). (C) ChIP-qPCR analysis of EHMT2 binding at HMRs in E8.5 embryos (mean ± SEM, n = 4). (D) Browser views of EHMT2 ChIP-seq profiles in ESCs (Mozzetta et al. 2014) reveal that peaks of EHMT2 binding colocalize with promoter-proximal HMRs (red bars) at three germline genes. (E) Heatmap representation of the distribution of EHMT2 and H3K9 mono- and dimethylation at HMRs. The data represent the average density of ChIP-seq reads for EHMT2 in ESCs, H3K9me1/2 in ESCs, and H3K9me2 in E8.5 embryos normalized by the density of reads in the input control. (F) ChIP-qPCR analysis of H3K9me2 and H3K4me3 at HMRs in E8.5 embryos, represented as the percentage of input (mean ± SEM, n = 4). The promoters of the housekeeping genes Actb and Ube2f served as controls. (G) ChIP-qPCR analysis of H3K9me2 at four gene promoters in WT and Ehmt2−/− E8.5 embryos (mean ± SEM, n = 6 embryos for WT, n = 4 embryos for Ehmt2−/−). The heatmap on the bottom indicates CpG methylation measured by RRBS in the same promoters. (**) P < 0.01 (t-test).

