Figure 4.
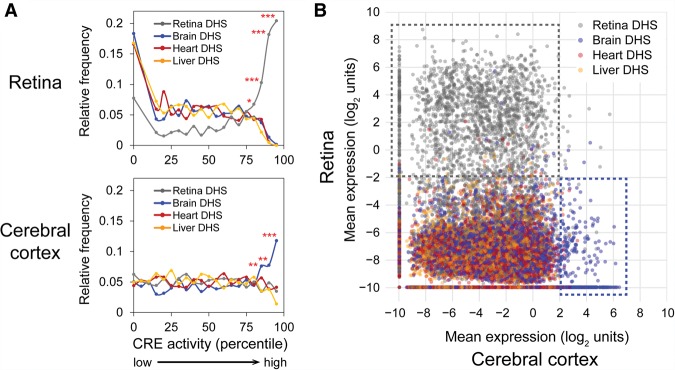
Tissue-specific cis-regulatory activity of DHSs. (A) Frequency distribution of DHSs ranked by cis-regulatory activity (bin size: 5 percentiles) as measured in the retina (top) or cerebral cortex (bottom). In the retina, ∼15% DHSs had undetectable activity and hence were binned together. Averages were taken across biological replicates and barcodes for a given target DHS. Only DHSs with at least two barcoded constructs were included in this analysis (about 3000 DHSs). Frequencies were normalized to the total number of DHSs in each category. To test for enrichment, a χ2 test was performed (one-tailed): (*) P<0.05; (**) P < 0.01; (***) P < 10−4. (B) Scatterplot showing the expression of individual barcoded constructs as assayed in the cerebral cortex (x-axis) versus retina (y-axis). Each dot represents an individual construct. For each construct, the average measurement across the three biological replicates for each tissue was taken. The approximately 35,000 barcodes that were well-represented (at least 10 DNA reads) in all six samples were included in the analysis. Gray, blue, red, and orange dots denote constructs with CRE fragments that overlap retina, brain, heart, and liver DHSs, respectively. The dotted gray box encompasses constructs that are strongly active in the retina, and the dotted blue box encompasses constructs that are strongly active in the cortex.

