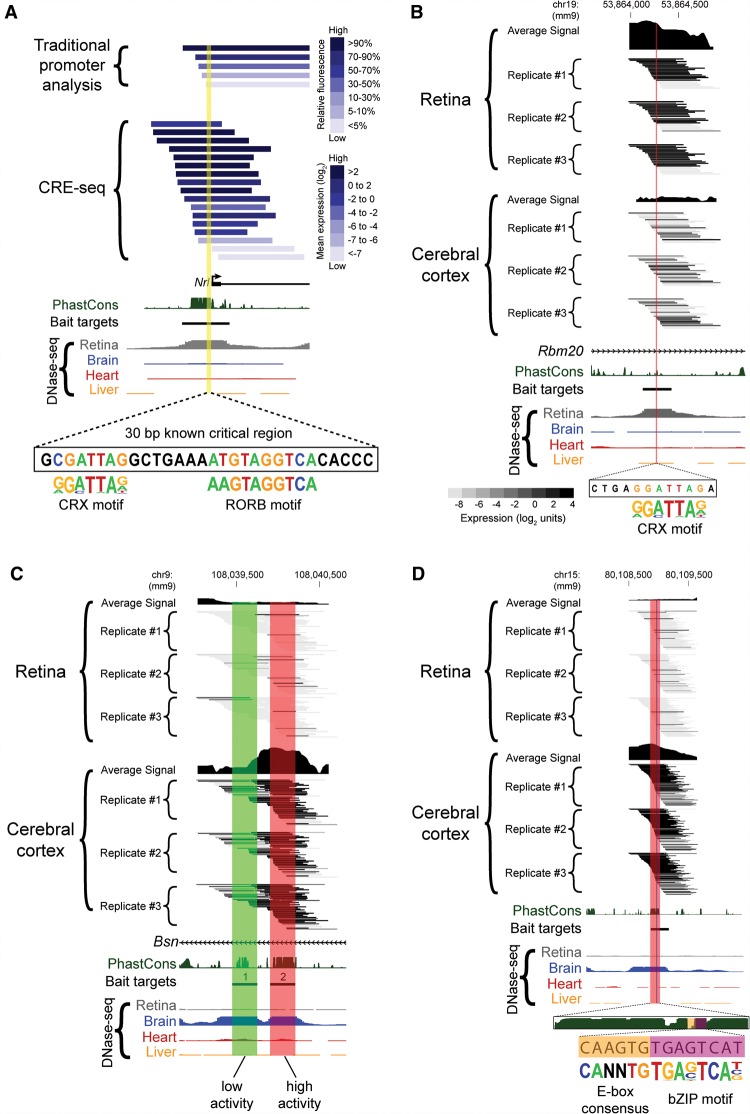
Figure 6.
Truncation mutation analysis by CRE-seq. (A) Example of a truncation mutation analysis at the Nrl promoter via a traditional one-at-a-time reporter assay (Montana et al. 2011b) versus capture-and-clone CRE-seq. For the traditional reporter constructs, the 3′ end extends beyond the window depicted in the figure. For the CRE-seq data, only barcoded constructs in the same orientation as the Nrl promoter are shown. The yellow highlighted region corresponds to a known critical region with CRX and RORB motifs (André et al. 1998; Montana et al. 2011b). The minus strand of DNA is displayed. In A and B, the CRX motif (from HOMER) (Heinz et al. 2010) is based on CRX ChIP-seq data (Corbo et al. 2010). The reverse orientation of the CRX motif is displayed. (B–D) Additional examples of CRE-seq truncation mutation analysis: (B) Retinal DHS with retina-specific expression. The critical region identified by CRE-seq (red) contains a putative CRX motif. (C) Two adjacent brain DHSs in the same intron of Bsn exhibit low (DHS #1, green) versus high (DHS #2, red) activity in the cortex. (D) Truncation mutation analysis of a brain DHS. A gradual decrease in activity was observed within the ∼150-bp critical region (red), corresponding to a phylogenetically conserved peak. Within this critical region, a smaller region (vertical blue stripe) was identified that contained an E-box consensus motif (“CANNTG”) and a motif for a bZIP protein, based on AP-1 ChIP-seq data (Heinz et al. 2010). All browser images are from the UCSC Genome Browser (mm9) (Karolchik et al. 2014). DNase-seq data are from Mouse ENCODE (Yue et al. 2014). PhastCons depict 30-way vertebrate phylogenetic conservation (Siepel et al. 2005). The heat map scale shown in B is the same as that used in C and D.

