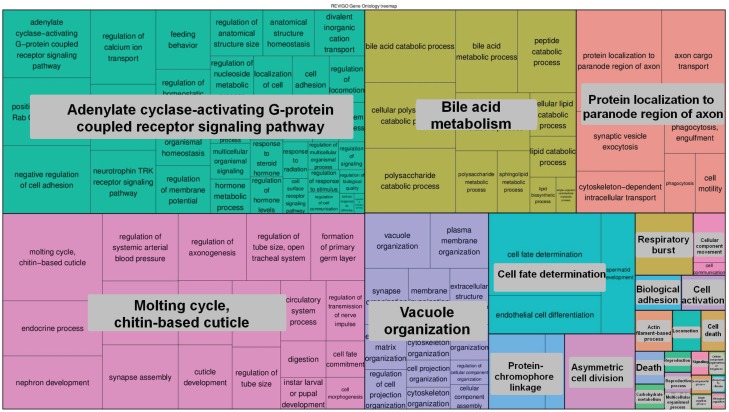
Figure 5.
The GO terms (biological process) that were enriched for genes prone to 5-hmC modification. The areas of rectangles are proportional to the relative increase in frequency of GO terms comparing genes that had 5-hmC related peaks to genes that completely lacked them. The corresponding quantitative data and a full list of GO terms can be found in Supplementary File S1.

