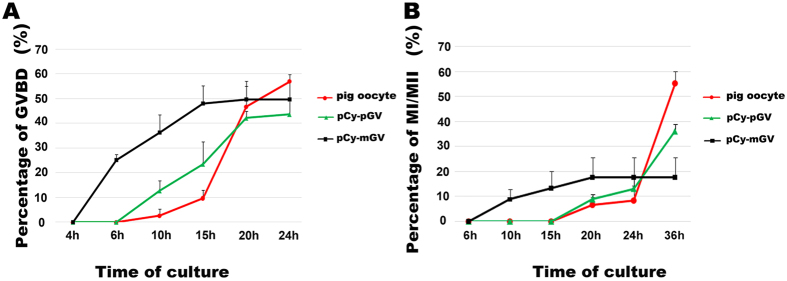
Figure 5. In vitro maturational time course of pig oocyte and pCy-mGV oocytes.
(A) Percentages of GVBD in pig oocytes (4 h: 0%; 6 h: 0%; 10 h: 3.54 ± 1.62%; 15 h: 9.71 ± 3.31%; 20 h: 46.73 ± 8.44%; 24: 56.94 ± 2.98%), pCy-pGV oocytes (0 h: 0%; 6 h: 0%; 10 h: 12.58 ± 3.09%; 15 h: 23.48 ± 9.19%; 20 h: 42.12 ± 2.92%; 24 h: 43.64 ± 5.53%) and pCy-mGV oocytes (4 h: 0%; 6 h: 25.24 ± 2.20%; 10 h: 36.27 ± 7.17%; 15 h: 48.19 ± 7.11%; 20 h: 49.77 ± 7.44%; 24: 49.77 ± 7.44%) were observed at 4 h, 6 h, 10 h, 15 h, 20 hand 24 h of in vitro culture. pCy-mGV oocytes reached the GVBD stage at 6–20 h of culture which was 4 hearlier than the pig oocytes (20–24 h). B: Percentages of pig oocytes (6 h: 0%; 10 h: 0%; 15 h: 0%; 20 h: 6.67 ± 2.89%; 24 h: 8.33 ± 5.77%; 36 h: 55.00 ± 5.00%), pCy-pGV oocytes (6 h: 0%; 10 h: 0%; 15 h: 0%; 20 h: 8.86 ± 2.04%; 24 h: 13.10 ± 4.29%; 36 h: 35.98 ± 2.79%) and pCy-mGV oocytes (6 h: 0%; 10 h: 8.75 ± 3.98%; 15 h: 13.19 ± 6.88%; 20 h: 17.50 ± 7.95%; 24 h: 17.50 ± 7.95%; 36 h: 17.50 ± 7.95%) reaching the MI stage were detected at 6 h, 10 h, 15 h, 20 h, 24 hand 36 h of in vitro culture. pCy-mGV oocytes reached the MI stage at 10–20 h of in vitro culture which was 10 hearlier than the pig oocyte (20–36 h).

