
Figure 7. SEM-micrograph where the β-Y2Si2O7 growth structure is framed in red.
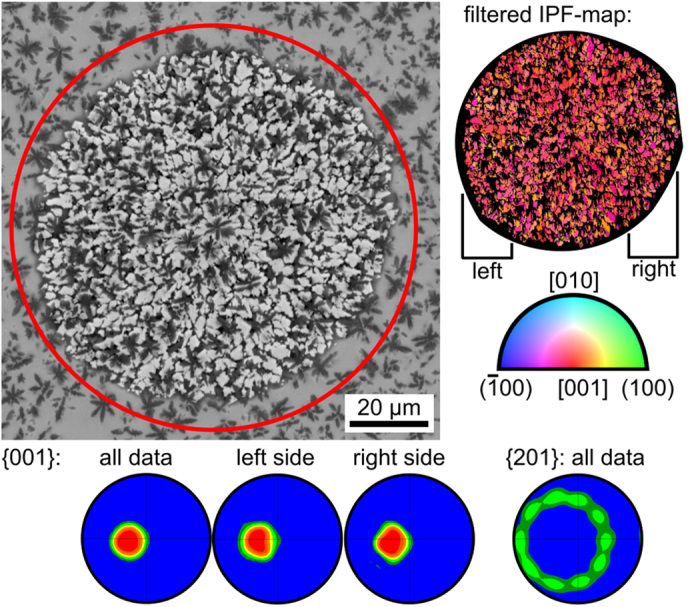
To the right: IPF + IQ-map of an EBSD scan performed on this area. Bottom: pole figures of the EBSD-scan. The ten maxima in the 201-PF are all arranged on a circle giving evidence of the five fold symmetry.