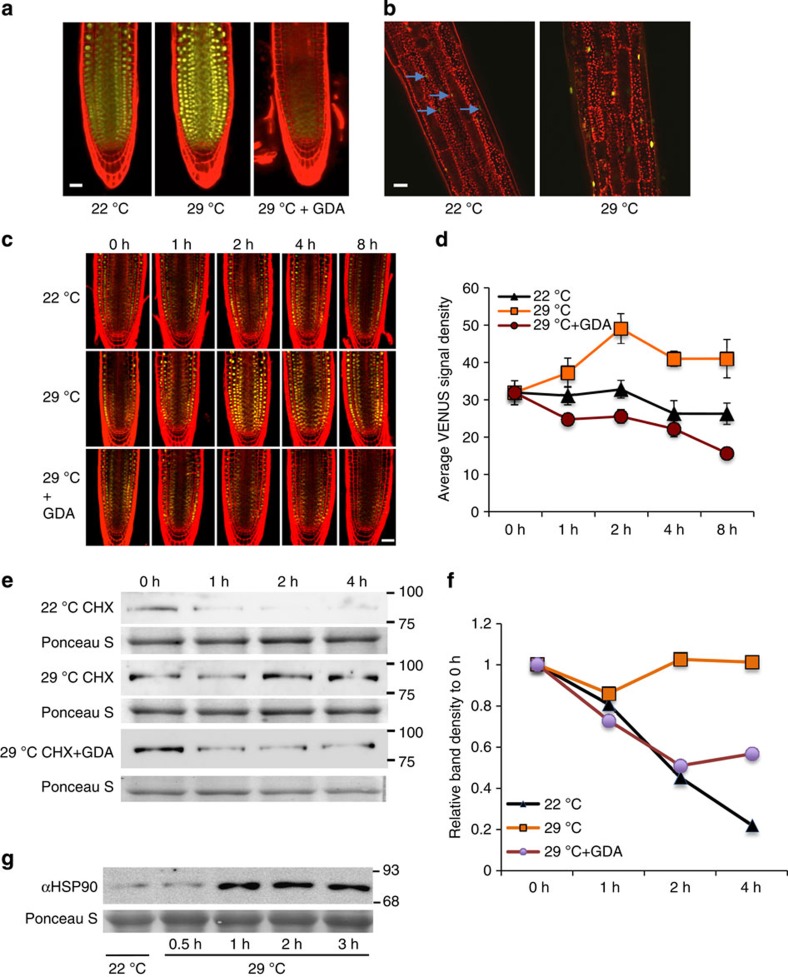
Figure 4. TIR1 levels rapidly increase in response to elevated temperature.
(a,b) Five-day old pTIR:gTIR1-VENUS seedlings were shifted from 22 to 29 °C. The root tip (a) and the hypocotyl (b) were imaged after 24 h. In a, seedlings were also treated with 10 μM GDA (G). (c) Seedlings were treated as above and imaged at time intervals as shown. (d) Quantification of TIR1-VENUS levels from c. At least four seedlings were imaged for each time point. Error bars=s.d. (e) Five-day-old pTIR1:gTIR1-VENUS seedlings were transferred to 22 or 29 °C for 2 h and then treated with 200 μM CHX with our without 10 μM GDA at either 22 or 29 °C. Samples were collected at various time for protein blots. The experiment was repeated three times with similar results. (f) Quantitative protein blot band density is presented as relative to time zero of CHX treatment. (g) Five-day old Col-0 seedlings were shifted from 22 to 29 °C and HSP90 levels were determined by protein blot. Scale bars, 50 μm (a,b,c).

