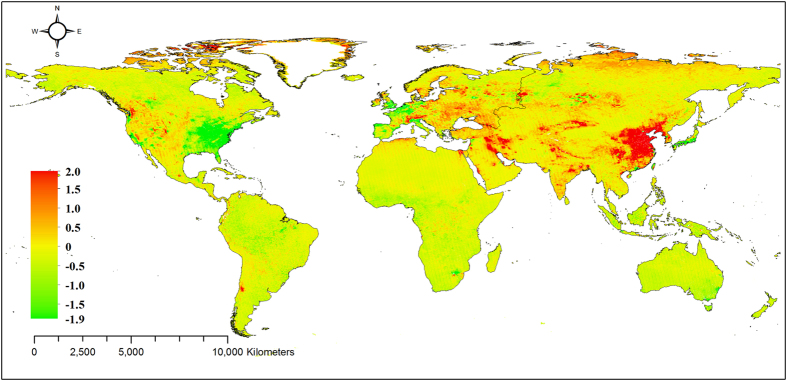
Figure 3. The average annual changes in dry N deposition fluxes (kg N ha−1 a−1).
Note: The slope was calculated by plotting annual dry deposition fluxes against time from 2005 to 2014 in each grid, and the slope value was used to represent the annual change rate. Due to the lack of continuous data for NH3 fluxes, the trend analysis of dry deposition only included annual changes of NO2, HNO3, NH4+, and NO3− fluxes. The map was generated using ArcGIS 10.0 software.

