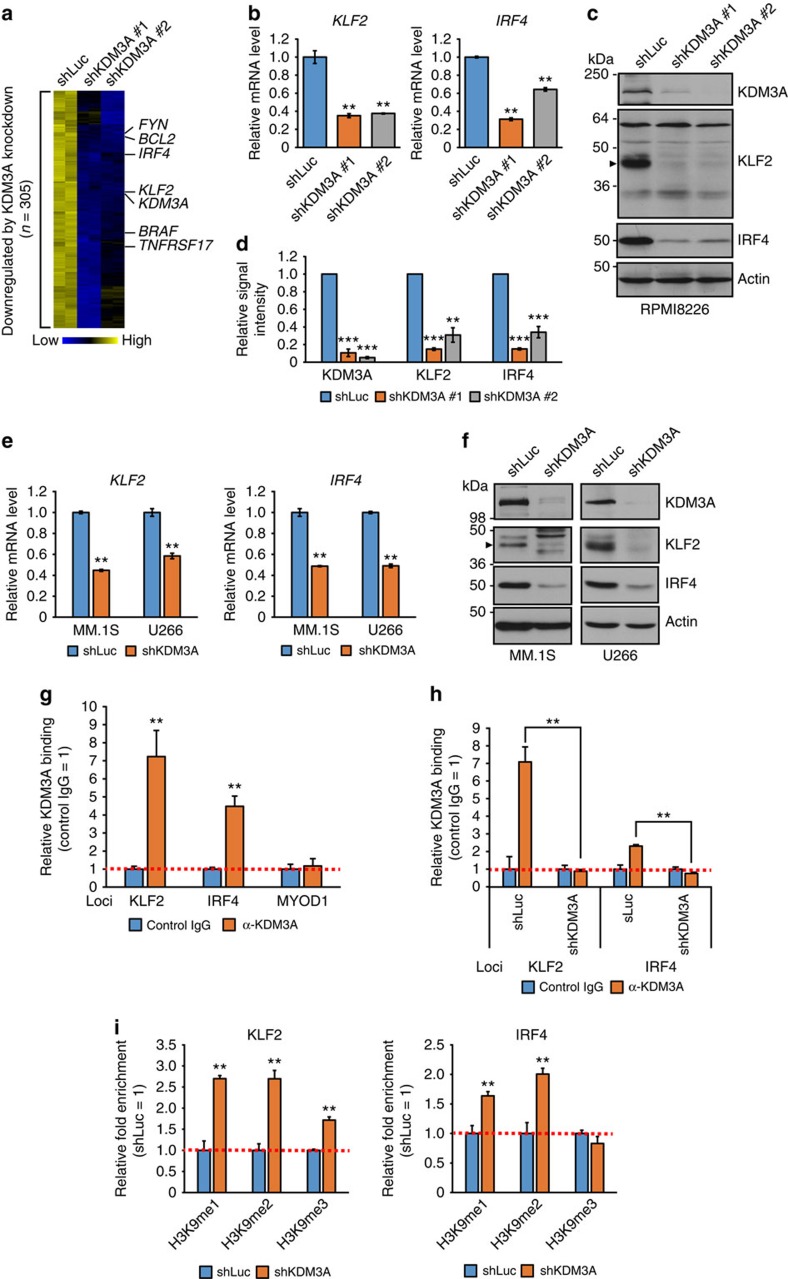
Figure 3. KDM3A directly regulates KLF2 and IRF4 expression through H3K9 demethylation at their promoters in MM cells.
(a) Heatmap depicting the relative gene expression in RPMI8226 cells transduced with two independent shRNAs targeting KDM3A (shKDM3A #1 and shKDM3A #2) or shLuc. A total of 305 probes were selected based on ≥1.5-fold downregulation in KDM3A-knockdown cells and clustered. (b–d) Quantitative real-time PCR (b) and immunoblot (c,d) analysis of KLF2 and IRF4 in RPMI8226 cells transduced with either shKDM3A or shLuc. After 3 days of infection, which is defined as day 0 in Fig. 2, cells were harvested for isolation of total RNA or whole-cell lysates. (b) Values represent the amount of mRNA relative to shLuc, defined as 1. (c) Arrowhead represents KLF2. (d) Signal intensity of each immunoblot was quantified using the ImageJ software. Results were normalized by Actin and are shown as relative signal intensity (shLuc=1). Error bars represent s.e.m of three independent experiments. (e,f) Quantitative real-time PCR (e) and immunoblot (f) analysis of KLF2 and IRF4 in MM.1S and U266 cells transduced with either shKDM3A or shLuc. After 3 days of infection, cells were harvested for isolation of total RNA or whole-cell lysates. (g) ChIP analysis showing KDM3A occupancy on KLF2 and IRF4 core promoters in RPMI8226 cells. Results were normalized to control IgG. The MYOD1 promoter region was used as negative control. (h) KDM3A occupancy is abrogated by KDM3A knockdown on KLF2 and IRF4 promoter regions in RPMI8226 cells. RPMI8226 cells transduced with either shKDM3A or shLuc were used for ChIP, followed by quantitative real-time PCR. (i) Enrichment of H3K9 methylation by KDM3A knockdown on KLF2 and IRF4 promoter regions in RPMI8226 cells. ChIP assays were performed with RPMI8226 cells transduced with either shKDM3A or shLuc. The relative enrichment over the input was assessed. Results are shown as fold enrichment compared with control shLuc. For b,e,g–i, error bars represent s.d. of triplicate measurements. For b–i, data are representative of at least two independent experiments. **P<0.01, ***P<0.001 compared with control; Student's t-test.

