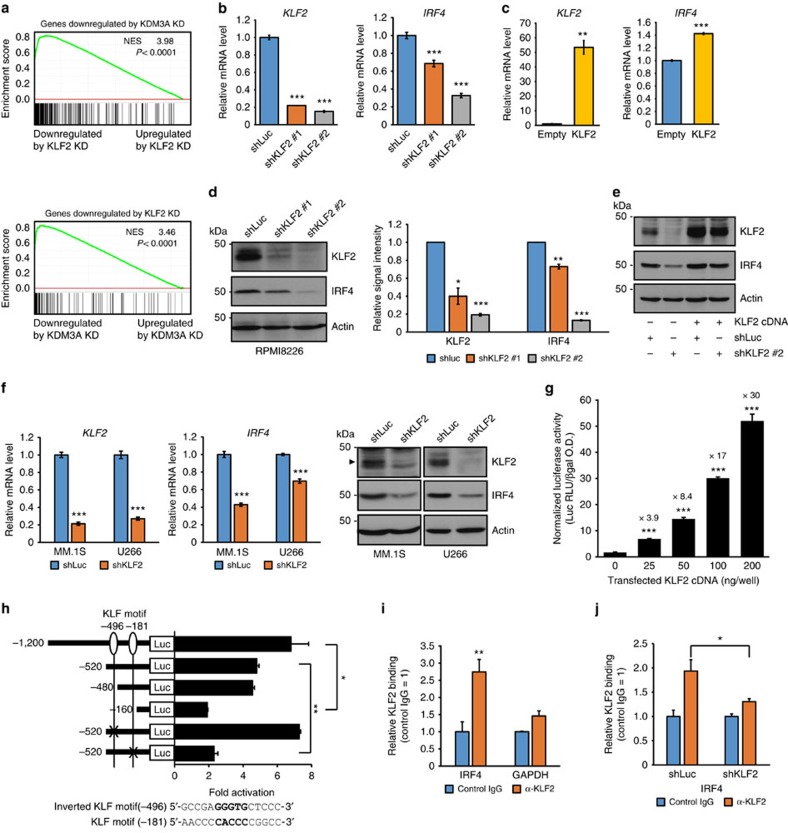
Figure 5. IRF4 is a direct transcriptional target of KLF2 in MM cells.
(a) Microarray analysis in RPMI8226 cells transduced with shKDM3A, shKLF2 or shLuc was performed. The genes significantly downregulated by KDM3A or KLF2 knockdown compared with control were used as gene sets for the GSEA. Normalized enrichment score (NES) and P values are shown. (b,c) Quantitative real-time PCR of KLF2 and IRF4 after knockdown (b) and overexpression (c) of KLF2 in RPMI8226 cells. (d) Immunoblot analysis of KLF2 and IRF4 after knockdown of KLF2 in RPMI8226 cells. Shown are the relative signal intensity (shLuc=1) normalized by Actin. Error bars represent s.d. of two independent experiments. (e) RPMI8226 cells expressing the KLF2 cDNA carrying synonymous mutations in the shKLF2 #2 target sequence or empty vector were transduced with shKLF2 #2 or shLuc. Whole-cell lysates were subjected to immunoblot analysis. (f) Quantitative real-time PCR and immunoblot analysis of KLF2 and IRF4 after knockdown of KLF2 in MM.1S and U266 cells. (g) Transactivation of the IRF4 promoter by KLF2. The indicated amounts of KLF2 expression plasmids were transfected into 293T cells together with the human IRF4 promoter-luciferase reporter. The value above each bar indicates the induction level compared with empty vector. (h) 293T cells were co-transfected with the indicated IRF4-luciferase reporter and 0.04 μg of KLF2 expression plasmid or empty vector, and then assayed for luciferase activity. The fold activation (normalized luciferase activity co-transfected with KLF2 expression plasmid relative to empty vector) is shown. (i) ChIP analysis showing KLF2 occupancy on IRF4 promoter in RPMI8226 cells. GAPDH promoter was used as negative control. (j) KLF2 occupancy is abrogated by KLF2 knockdown on IRF4 promoter in RPMI8226 cells. RPMI8226 cells transduced with either shKLF2 or shLuc were used for ChIP. For b,c,f,i,j, error bars represent s.d. of triplicate measurements. For g,h, data represent mean±s.d. of three (g) or two (h) biological replicates. For b–j, data are representative of at least two independent experiments. *P<0.05, **P<0.01, ***P<0.001 compared with control; Student's t-test.

