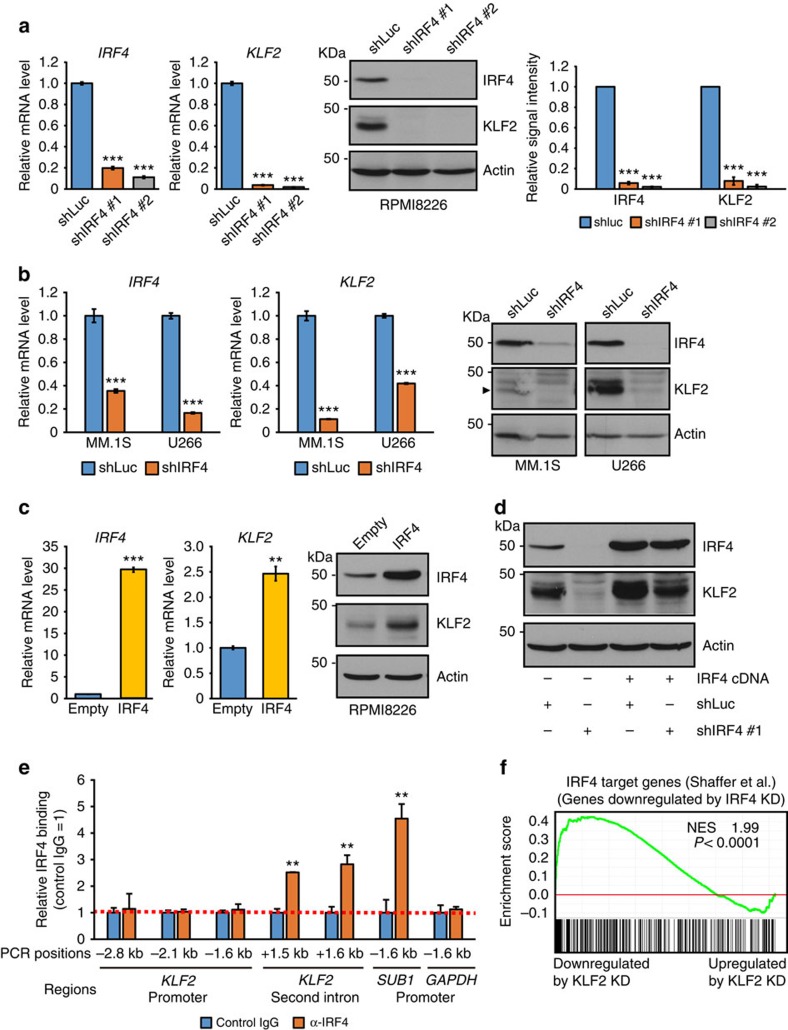
Figure 6. KLF2 is a direct target of IRF4 transactivation in MM cells.
(a,b) Quantitative real-time PCR and immunoblot analysis of IRF4 and KLF2 in RPMI8226 (a), MM.1S and U266 (b) cells transduced with either shRNA targeting IRF4 (shIRF4) or shLuc. (a, right panel) Shown are the relative signal intensity (shLuc=1) normalized by Actin. Error bars represent s.e.m. of three independent experiments. (c) Quantitative real-time PCR and immunoblot analysis of IRF4 and KLF2 after overexpression of IRF4 in RPMI8226 cells. (d) RPMI8226 cells expressing the IRF4 cDNA or empty vector were transduced with shIRF4 #1 that targets the 3′ untranslated region of IRF4 or shLuc by lentivirus. Whole-cell lysates were subjected to immunoblot analysis with antibodies against IRF4 and KLF2. (e) ChIP analysis showing IRF4 occupancy on KLF2 second intron in RPMI8226 cells. ChIP assays were performed for the regions that contain tandem IRF4 motifs on KLF2 promoter and intron (indicated PCR positions are relative to the transcriptional start site). Results were normalized to control IgG. The SUB1 promoter29 or GAPDH promoter was used as positive or negative control, respectively. (f) Significant correlation between the genes downregulated by KLF2 knockdown and IRF4 knockdown in MM cells. The genes significantly downregulated by IRF4 knockdown29 were used as gene set for GSEA. NES and P values are shown. For a (left panel), b,c,e, error bars represent s.d. of triplicate measurements. For a–e, data are representative of at least two independent experiments. **P<0.01, ***P<0.001 compared with control; Student's t-test.

