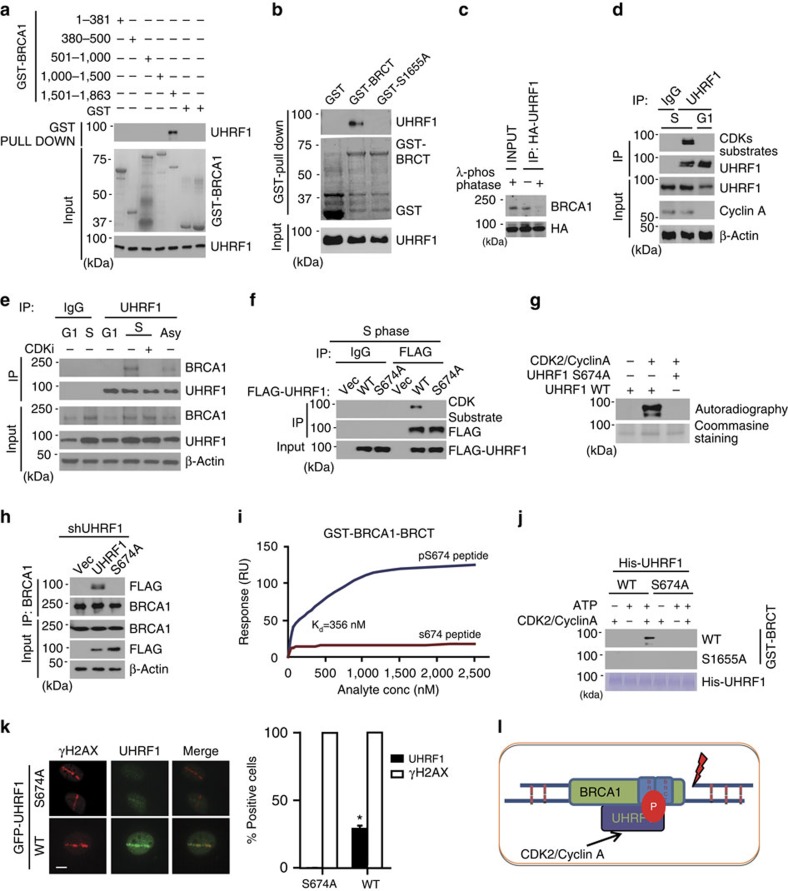
Figure 2. BRCA1 recruits UHRF1 to DSBs through BRCT domain.
(a) GST-pull-down assay of UHRF1 using the indicated GST fusion proteins. (b) GST-pull-down assay of UHRF1 using wild-type BRCA1 BRCT domain or S1655A mutant. (c) UHRF1’s association with BRCA1 depends on phosphorylation. HEK 293T cells transfected with HA-UHRF1 were treated as indicated. The UHRF1–BRCA1 interaction was examined. (d) UHRF1 was phosphorylated by CDKs in S phase. HeLa cells were synchronized, and UHRF1 phosphorylation was examined with indicated antibodies. (e) CDKs inhibitor abolishes the interaction between UHRF1 and BRCA1 in S phase. HeLa cells were synchronized and treated with Roscovitine. UHRF1 phosphorylation was examined as indicated. (f) UHRF1 Ser674 was phosphorylated in S phase. HEK 293T cells transfected with the indicated constructs were synchronized at S phase, UHRF1 phosphorylation was examined. vec: empty vector. (g) UHRF1 is phosphorylated by CDK2/cyclin A. In vitro kinase assay was performed with CDK2/cyclin A using recombinant wild-type UHRF1 or UHRF1-S674A mutant as substrates. (h) Ser674 was important for UHRF1–BRCA1 interaction. HEK 293T cells stably expressing UHRF1 shRNA were transfected with indicated constructs. The BRCA1–UHRF1 interaction was examined following synchronization to S phase. (i) GST-BRCA1-BRCT fusion protein (17 nM to 2.5 μM) was passed over BIAcore chip (SA chip) surfaces immobilized with control peptide or phosphorylated S674 peptide. Resonance units were measured by BIAcore TP200. (j) Phosphorylated UHRF1 directly bind the BRCT domain of BRCA1. His-UHRF1 protein was subjected to CDK2/cyclin A phosphorylation or mock treatments in vitro, and resolved by SDS–PAGE. The binding of UHRF1 to the BRCT domain was analysed by Far-western blots. (k) Ser674 phosphorylation is important for UHRF1 accumulation at DSBs. U2OS cells were transfected with wild-type GFP-UHRF1 or S674A mutant. DSBs accumulation was monitored following laser microirradiation. For each sample, 200 cells were counted. Error bars represent the mean±s.d. of biological triplicates. Left: representative images; Right: quantification of positive signal. Error bars represent the mean±s.d. of biological triplicates. UHRF1 recruitment positive cell percentage compared with control group: *P<0.05. Scale bar, 10 μm. (l) Schematic model illustrating Figs 1–2.

