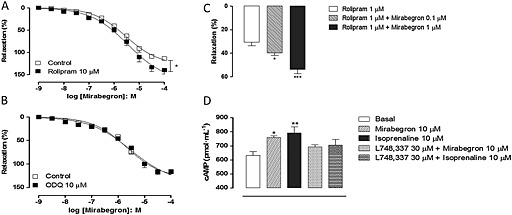
Figure 2.

Concentration–response curves to mirabegron in mouse isolated urethra smooth muscle and cyclic AMP production. Relaxant responses were measured with or without either rolipram (10 μM; A) or ODQ (10 μM; C). Responses to rolipram (1 μM) were measured in the presence of threshold concentrations of mirabegron (0.1 and 1 μM; B). Cyclic AMP production in mirabegron and isoprenaline‐stimulated urethra in the presence of L‐748,337 is shown in (D). Relaxations were calculated relative to the maximal changes from the contraction produced by phenylephrine (10 μM) in each urethral ring, which was taken as 100%. Data are presented as mean ± SEM. (n = 4–6). * P < 0.05, ** P < 0.01; significantly different from corresponding respective control/basal; anova followed by Tukey's test.
