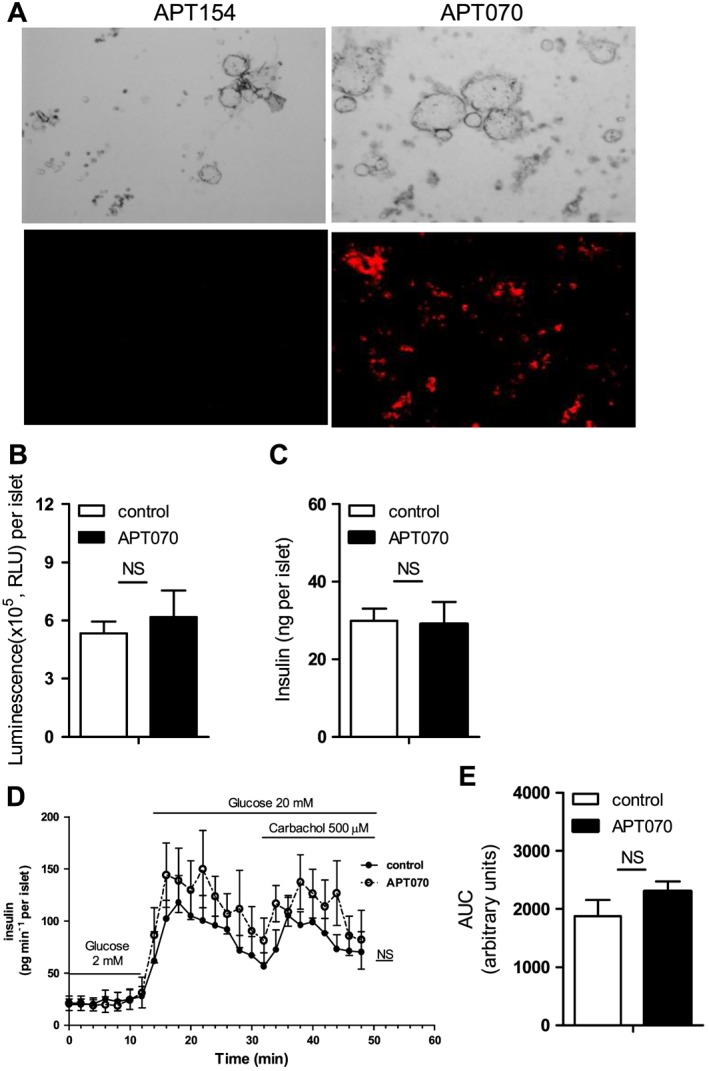
Figure 2.

Assessment of islet viability and secretion function. (A) Binding of APT070 (0.4 μM) to human islets one hour after incubation. Positive binding is shown in red. Amplifier power: × 60. (B) Islet viability assay. Luminescent outputs, which correlated with islet cell numbers, were measured in APT070 treated and control islets. Values represent the mean ± SD, n = 6 (wells of 96‐well plate). (C) Intracellular insulin content in APT070‐treated and control islets. The data are expressed as means ± SD, n = 6. (D, E) The dynamics of insulin release. Data are shown as means ± SD, n = 8 perifusion channels. RLU: relative luminescence units. AUC: area under curve. Control islets received no treatment. NS: no significant difference.
