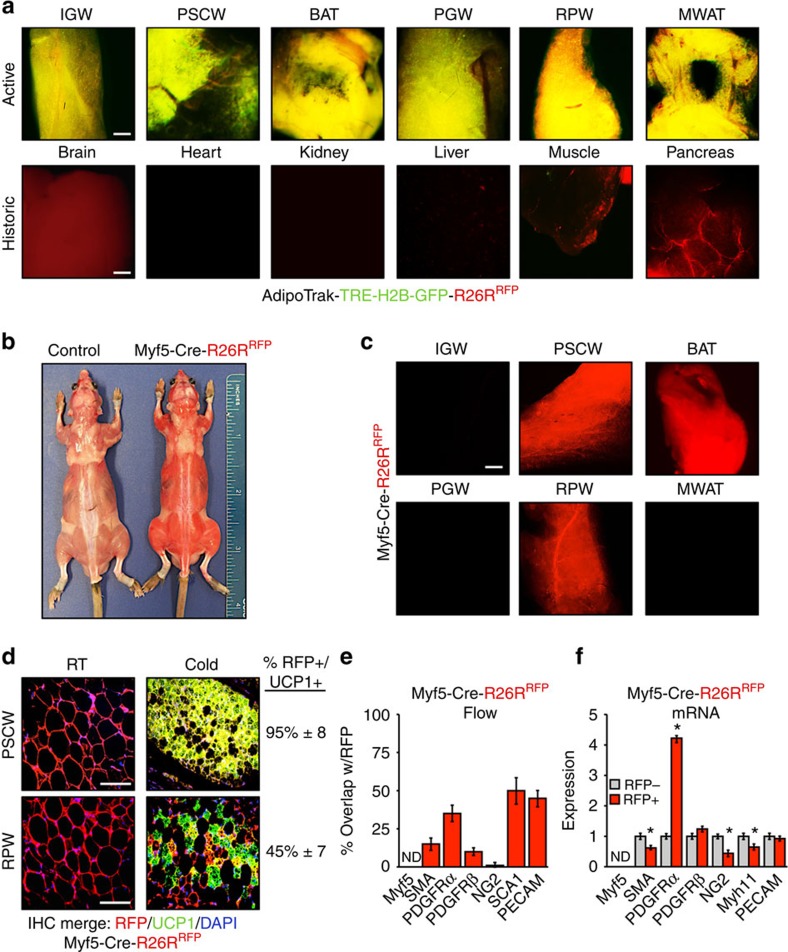
Figure 4. AdipoTrak and Myf5 model characterization.
(a) Merged (H2B-GFP and RFP) whole-mount images of denoted adipose depots and other tissues from 2-month-old AdipoTrak (PPARγτTA,TRE-Cre); TRE-H2B-GFP; R26RRFP male mice and control (PPARγtTA; RFP) mice. BAT, classical brown adipose tissue; IGW, inguinal; MWAT, mesenteric white adipose tissue; PGW, perigonadal; PSCW, periscapular; RPW, retroperitoneal. Scale bar, 10 μm. (b) Image of control (R26RRFP) and Myf5-Cre; RFP male mice. Please note the RFP fluorescence was easily observed in regular room lighting from the Myf5-Cre; RFP mouse. (c) Fluorescence microscopic whole-mount images of RFP fluorescence from denoted adipose depots from 2-month-old Myf5-Cre; RFP RT mice. Scale bar, 10 μm. (d) Two-month-old Myf5-Cre; RFP male mice were maintained at RT or cold exposed for 7 days. Histological sections from periscapular (top: PSCW) and retroperitoneal (bottom: RPW) adipose depots were examined for RFP fluorescence and UCP1 (green) expression. Cell nuclei were counterstained with DAPI (blue). Quantification of UCP1+ beige adipocytes that were RFP+ is denoted next to the IHC image. (e) Adipose depot cells from 2-month-old Myf5-Cre; RFP mice were analysed by flow cytometry for co-expression of RFP with the indicated genes. (f) Adipose depot cells from 2-month-old Myf5-Cre; RFP male mice were separated into RFP+ and RFP− fractions using FACS and examined for mRNA expression of denoted genes using qPCR. ND, not detected. Data are means±s.e.m. (n=4–5 mice per group replicated twice). Scale bar, 100 μm. Student's t-test, *P<0.05, RFP+ compared with RFP−.

