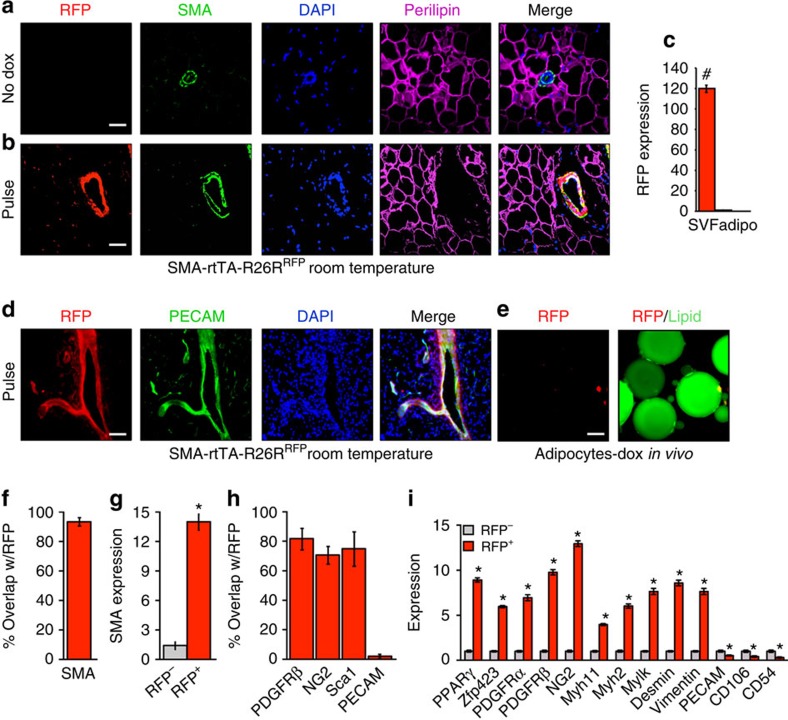
Figure 6. SMA-rtTA characterization.
(a) Subcutaneous inguinal adipose depots from 2-month old uninduced (no Dox) SMA-rtTA; RFP (SMA-rtTA; TRE-Cre; R26RRFP) male mice maintained at RT were immunostained for RFP, SMA and perilipin. Cell nuclei were counterstained with DAPI (blue). (b) Subcutaneous inguinal adipose depot sections from 2-month old Dox-pulse SMA-rtTA; RFP male mice maintained at RT were immunostained for RFP, SMA and perilipin; nuclei were highlighted with DAPI. (c) SV cells and adipocytes were isolated from 2-month old pulse SMA-rtTA; RFP male mice maintained at RT. mRNA expression of RFP were assessed by qPCR. Data are means±s.e.m. (n=4–5 mice per group). Students t-test, #P-value <0.001, SVF compared with adipocyte compartment. (d) Subcutaneous inguinal adipose depots from 2-month old pulsed SMA-rtTA; RFP male mice maintained at RT were sectioned and immunostained for RFP and PECAM (green), and nuclei stained with DAPI. (e) Adipocytes were isolated pulse SMA-rtTA; RFP mice described in d and visualized for RFP and lipid (green). (f) Adipose depot cells of pulse SMA-rtTA; RFP mice as described in d were analysed for co-expression of RFP and SMA. (g) RFP− and RFP+ cells were FACS isolated from pulse SMA-rtTA; RFP mice and SMA mRNA expression was assessed using qPCR. (h) Adipose cells of pulse SMA-rtTA; RFP mice were flow analysed for co-expression of RFP with mural or endothelial markers. (i) RFP− and RFP+ cells were FACS isolated from pulse SMA-rtTA; RFP mice and mRNA expression of various adipose progenitor, mural and endothelial markers were assessed by qPCR. Data are means±s.e.m. (n=5 mice per group replicated twice). Images are representative from n=4 mice per group replicated twice. Scale bar, 100 μm. Students t-test, *P-value <0.01, RFP+ compared with RFP−.

