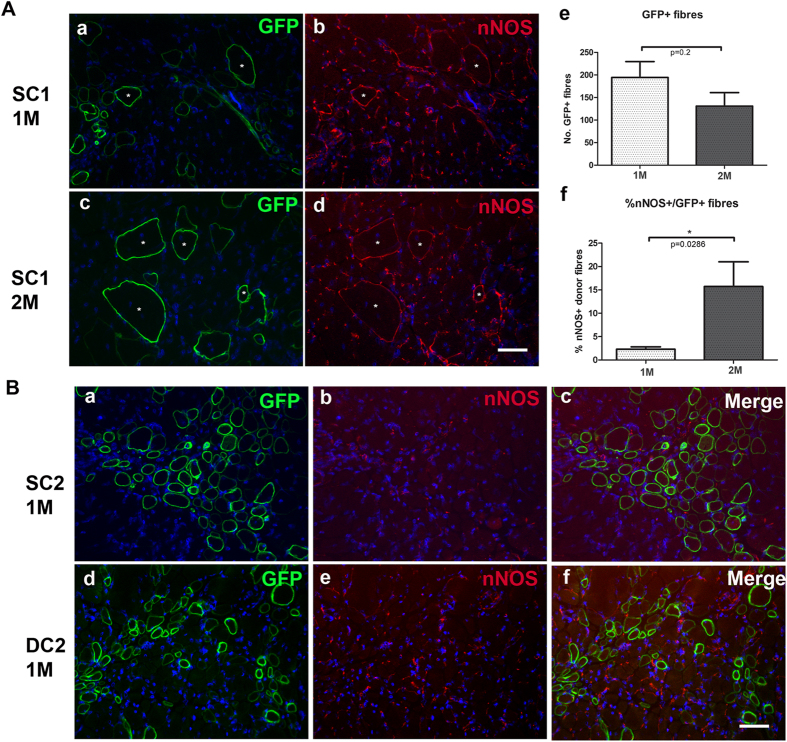
Figure 6. Recruitment of nNOS in dystrophin- expressing regenerated myofibres in vivo.
(A) Recruitment of nNOS in SFFV-C1-GFP- expressing regenerated myofibres in vivo. (a–d): Fibres expressing nNOS (red, b, d) that were also GFP+ (green, a, c) on a representative transverse section of host muscle that had been cryodamaged and transplanted with SFFV-C1-GFP cells one month (a,b) or two months (c,d) previously. Nuclei were counterstained with DAPI (blue). Asterisks (*) indicate nNOS+/GFP+ fibres. Scale bar = 15 μm. (e) quantification of the number of GFP+ fibres in muscles that had been transplanted with SFFV-C1-GFP cells one or two months previously. There was no significant difference in the number of GFP+ fibres between the two time points, p = 0.2. (f) percentage of the GFP+ fibres that expressed nNOS. There was a significantly higher percentage of dystrophin- expressing fibres of donor origin that also expressed n-NOS, at two months than at one month after transplantation. *p = 0.0286. (B) nNOS was not expressed on regenerated muscle fibres of donor origin expressing either SFFV-C2-GFP (SC2) or hDesmin-C2-GFP (DC2). (a–c) double staining with antibodies to GFP (a) and nNOS (b) on a representative transverse section of muscle that had been transplanted with SC2 cells. (c) merged image of a and b. Nuclei were counterstained with DAPI (blue). Scale bar = 15 μm. (d–f) double staining with antibodies to GFP (d) and nNOS (e) on a representative transverse section of muscle that had been transplanted with DC2 cells. (f) merged image of d and e. Nuclei were counterstained with DAPI (blue). Scale bar = 15 μm.

