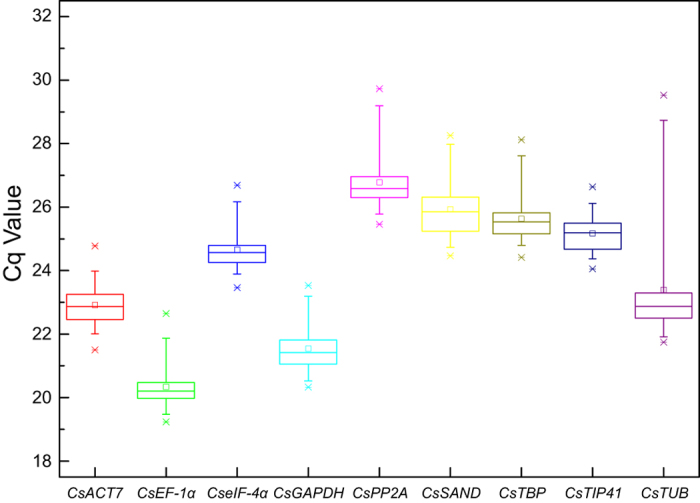
Figure 2. Cq values of nine candidate reference genes in all samples of C. sinensis.

Raw Cq values of ten samples, including five developmental stages of tea plant leaves and five different hormonal stimuli, were described using a box and whiskers plot. The outer box is determined from 25th to 75th percentiles, and the inner box represents the mean value. The line across the box is the median. The whiskers represent percentiles from 5th to 95th, and outliers are depicted by asterisks.
