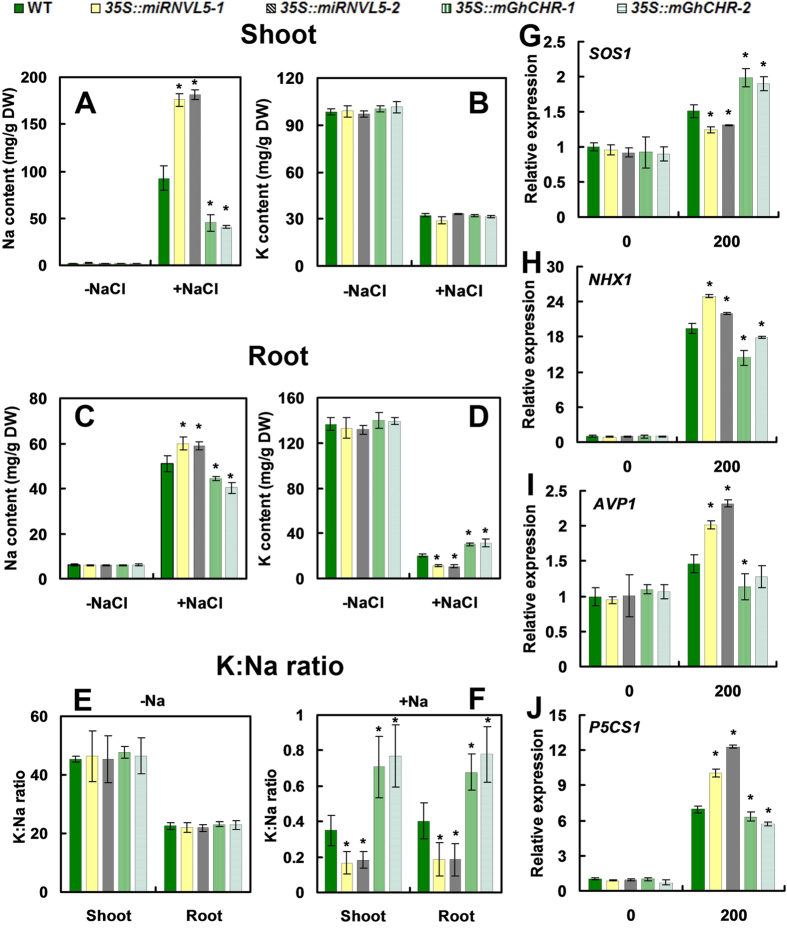
Figure 4. Sodium (Na+)/potassium (K+) accumulation and expression of SOS1, NHX1, AVP1 and P5CS1 in transgenic and wild-type (WT) plants exposed to NaCl.
(A,C) Na+ in shoots and roots. (B,D) K+ in shoots and roots of three week-old WT, 35S::miRNVLU5 and 35S::mGhCHR transgenic plants exposed to 200 mM NaCl exposure for 3 d. (E,F) K+/Na+ ratio in WT and the transgenic plants under −NaCl (E,F) and +NaCl (F) Condition. (G–J) qRT-PCR analysis of the indicated gene expression. Three week-old seedlings were exposed to 200 mM NaCl for 1 h. Vertical bars represent SD of the mean with three replicates. Asterisks indicate that mean values are significantly different between the transgenic plants and WT (p < 0.05).

