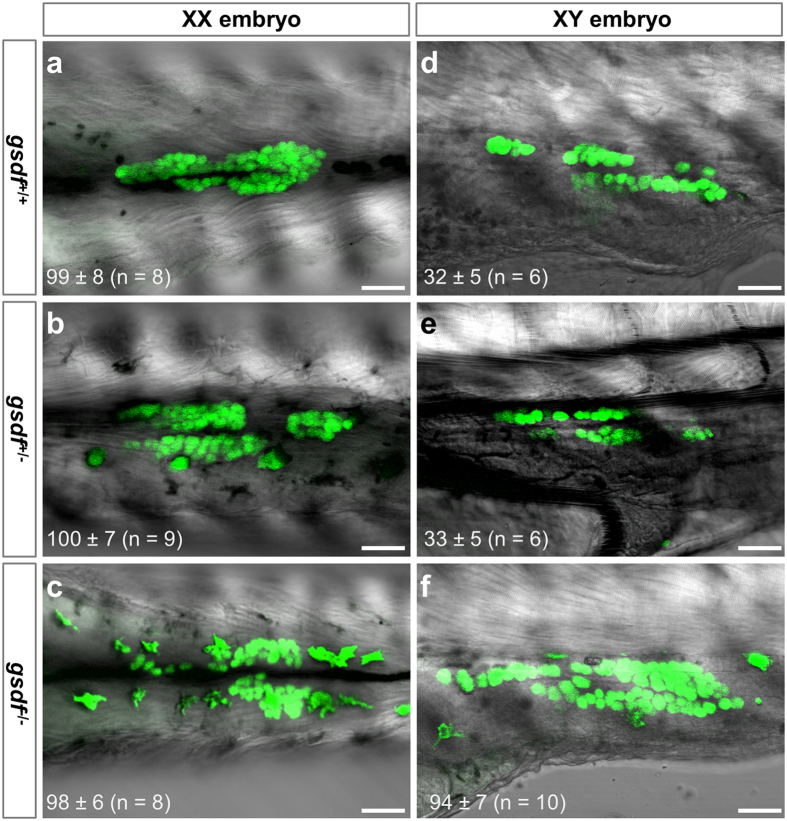
Figure 5. PGC abundance at early sexual differentiation.
Hatching F3 embryos (9 dpf) from crosses between gsdf+/− fish and Vg fish bearing GFP-labeled germ cells were analyzed by confocal microscopy and then genotyped. GFP-positive PGCs (green) are clearly visible in the gonad. (a–c), XX gonads, showing similar abundance of PGCs in normal (a), gsdf+/− (b) and gsdf−/− (c) embryos. (d–f), XY gonads, highlighting fewer PGCs in normal (d) and gsdf+/− embryos (e) than XX embryos (a–c), whereas the PGC number in gsdf−/− embryos (f) is comparable to that in XX embryos (a–c). Numbers of PGCs are presented as means ± SD with number of embryos examined are given in parenthesis. Scale bar, 50 μm.

