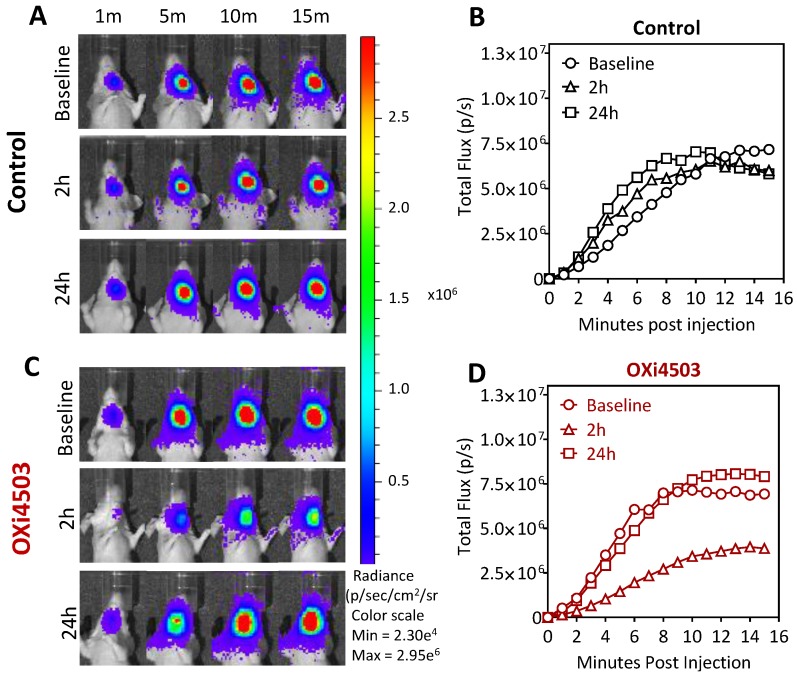
Figure 3.
Dynamic BLI of orthotopic FaDu-luc tumor vascular response to OXi4503. Representative images of dynamic series of bioluminescence images of a saline treated control animal (A) and OXi4503-treated animal (C), at baseline, 2 h, and 24 h post treatment. A series of images were acquired up to 15 min post luciferin administration at 1 min intervals. Corresponding plots of temporal changes in flux of control (B) and OXi4503-treated tumors (D) calculated from the BLI series. Data points represent mean values from three tumors per group.

