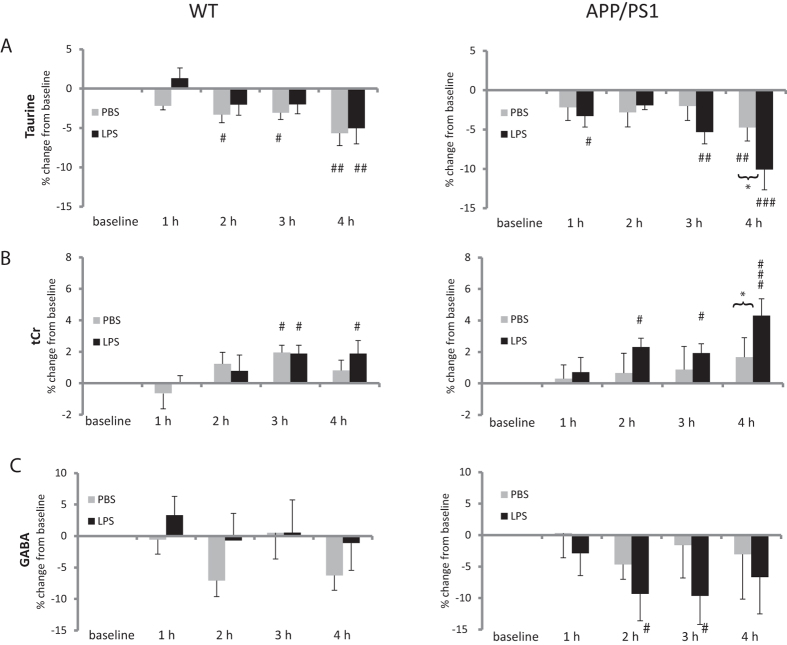
Figure 3. Late metabolic response in APP/PS1 mice.
Data are presented as mean ± SEM percent changes in metabolites levels relative to baseline. Metabolites levels were calculated as ratio to the sum of selected metabolites. (A) Taurine levels decreased with time regardless of genotype and treatment, suggesting a response to prolonged anaesthesia. In APP/PS1 mice, however, the reduction in taurine levels was significantly exacerbated by LPS at 4 h. (B) Opposite effects were seen for tCr levels, which increased with time, an effect exacerbated by LPS at 4 h in APP/PS1 mice. *p < 0.05, **p < 0.01 compared with PBS; #p < 0.05, ##p < 0.01, ###p < 0.01 compared with baseline levels.

