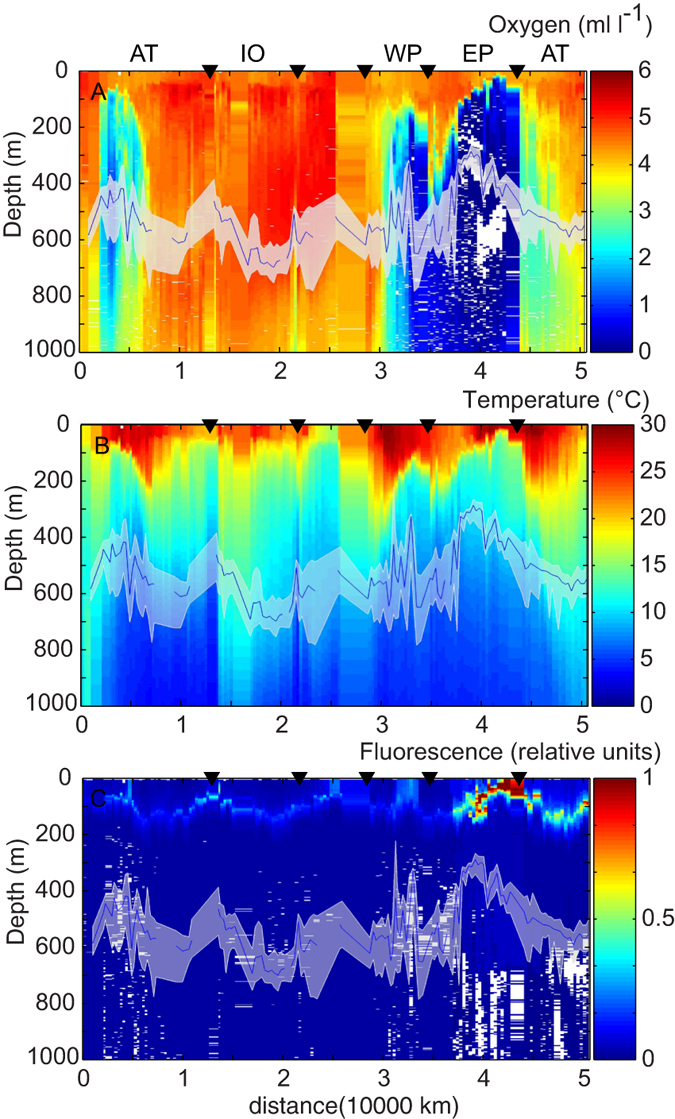
Figure 3. Environment and patterns of behaviour.

Median daytime WMD (m, blue line) along with 25 and 75% percentiles of daytime WMD (m) (white band) along the cruise track (km) overlaid on vertical profiles of dissolved oxygen levels (A), vertical profiles of temperature (B) vertical profiles of fluorescence (C). The cruise track is sectioned in different ocean basins by black triangles; starting from left moving throught the Atlantic, Indian Ocean, west Pacific, east Pacific and coming back through the Atlantic ocean.
