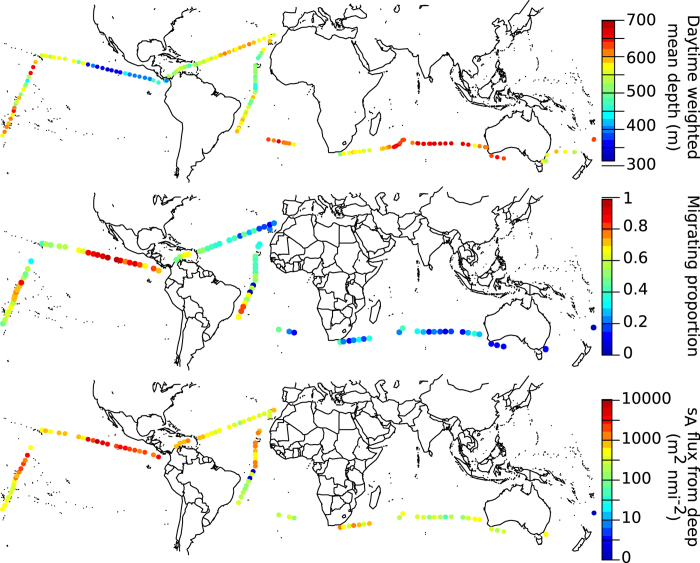
Figure 4. Global patterns in behavior.
(A) Global map with the cruise track overlayed, showing measured daytime weighted mean depth of acoustic backscatter (WMD, m), as colour. (B) Global map with the cruise track overlayed, showing estimated migrating proportion (MP) as colour. Calculation of migration proportion was based on ratio between night and day acoustic backscatter at mesopelagic depths. (C) Global map with cruisetrack overlayed, showing estimated net vertical transport from the mesopelagic zone as colour. Net transport was estimated based on change in acoustic backscatter in paired day/night values.

